

Global market alert: Strait of Hormuz
Following July’s severe disruptions, maritime activity through the Strait of Hormuz has entered a fragile resumption phase. While daily commercial transits have partially recovered, a return to normal commercial navigation remains distant, heavily complicated by severe compliance and sanctions risks.
The compliance trap: OFAC sanctions risk
A critical development is the hardening of US sanctions enforcement regarding the Strait of Hormuz. On 1 May 2026, the US Office of Foreign Assets Control (OFAC) issued a stark warning regarding Iranian demands for "toll" payments for safe passage.
Crucially, the sanctions risk begins long before any money changes hands.
- Risk Before Payment: Sanctions exposure begins long before any money changes hands. Exposure triggers the moment a vessel operator requests clearance, coordinates with Iranian authorities, or accepts an escort linked to sanctioned parties.
- Global Exposure: This applies globally. Non-US shipowners, charterers, insurers, and financing banks face secondary sanctions if a transaction or coordination provides value to a designated party, regardless of the payment form (fiat, crypto, or in-kind).
- Commercial Consequences: Yielding to forced coordination ensures physical passage but exposes the entire supply chain. Banks may refuse to finance subsequent transactions, and insurers may treat coordination as a material fact in claims.
Operators currently face a catch-22: refusing engagement protects against sanctions but leaves vessels stranded, delayed, or forced into escorted diversions. Conversely, yielding to forced coordination ensures physical passage but infects the entire supply chain—operator, charterer, insurer, and bank—with severe sanctions exposure.
Dual Chokepoint Crisis: The Bab el-Mandeb Threat
Compounding the Hormuz crisis, APAC shippers must now navigate a "dual chokepoint" reality. Recent Houthi declarations of a maritime blockade on Saudi ports and subsequent attacks have severely restricted traffic through the Bab el-Mandeb Strait (the southern gateway to the Red Sea).
Crucially, this chokes off the primary workaround utilised since the Hormuz closure, moving crude via the Saudi East-West Pipeline to Red Sea terminals. Consequently, Asian-bound volumes that previously transited Bab el-Mandeb are increasingly forced north via the Suez Canal/SUMED pipeline or onto the longer route around the Cape of Good Hope, adding significant transit time and cost.
Direct impacts on global and local logistics
While primary China-to-Australia shipping lanes do not physically transit the Gulf, systemic effects continue to generate severe friction across Oceania supply chains:
- Fuel surcharges (BAF/EBS): With crude benchmarks remaining volatile due to Middle East supply risks, structural deficits in marine distillate fuels persist. Shippers must brace for elevated Bunker Adjustment Factors (BAF) and Emergency Bunker Surcharges (EBS) across carrier tariffs heading into the September billing cycles.
- War risk insurance: War risk premiums for cargo originating in, destination-bound for, or transiting the Middle East Gulf remain near record highs. Furthermore, active shipments moving through Indian Subcontinent trades require continuous premium reviews due to regional security spillover and feeder network realignments.
- Persistent tonnage constraints via Cape rerouting: The fragile security environment guarantees that major ocean carriers (including Maersk, Hapag-Lloyd, and CMA CGM) will not resume Suez Canal transits in the near term. By locking substantial global container capacity into extended voyages around the Cape of Good Hope, global vessel supply remains artificially constrained. This prevents surplus tonnage from re-entering Asia–Oceania lanes to soften freight rates.
- Strict carrier booking restrictions: Mainline carriers continue to enforce strict booking limitations across Middle Eastern hubs. Ocean acceptance for upper-Gulf destinations remains severely curtailed; carriers such as ANL and MSC continue to limit ocean legs to hub ports like Khor Fakkan or Omani anchorages. Final delivery to inland Middle Eastern destinations relies heavily on pre-arranged overland road transport or specialised regional feeder networks.
What's happening in global freight
Global freight markets enter mid-August facing compounded operational pressure. Beyond the Middle Eastern maritime disruptions detailed previously, weather-related port closures in East Asia and surging Transpacific demand are combining to keep global capacity tight and schedules erratic.
- Macro capacity absorption: Extended routings around Africa remain the global baseline, absorbing 8% to 10% of global container fleet capacity. While this maintains an artificial floor under long-haul freight rates, it leaves ocean networks with zero buffer to absorb localised operational shocks.
- Northeast Asia weather disruptions: Recent severe weather—culminating in Super Typhoon Dolphin—has triggered multi-day terminal suspensions across key East China gateways (Shanghai, Ningbo-Zhoushan, Qingdao). The resulting port congestion and vessel queuing are driving widespread schedule slippage and emergency blank sailings on southbound Oceania loops. Detailed analysis in the Northeast Asia chapter
- Southeast Asian equipment and hub friction: A surge in early Transpacific bookings is draining empty container stock and feeder capacity toward major transshipment hubs (Singapore, Port Klang, Vietnam). This is creating acute equipment shortages and space tightness for regional export lanes. Detailed analysis in the Southeast Asia chapter
Global freight rates
Fuel surcharges remain structurally high across all trade lanes. Despite moderating crude oil benchmarks, marine distillate tightness ensures Bunker Adjustment Factors (BAF) and Emergency Bunker Surcharges (EBS) will stay elevated into September billing cycles.
Key takeaways
- NE Asia rates hit floor: The late-July rate softening ex-Northeast Asia has paused. Severe weather backlogs (Super Typhoon Dolphin) and carrier capacity discipline (blank sailings) have restricted effective vessel supply, holding rate floors steady ahead of the September volume build-up.
- SE Asia lanes continue rising: Driven by strong Transpacific export demand draining regional equipment and feeder capacity, rates ex-Southeast Asia face ongoing upward pressure amid persistent transshipment hub congestion.
- ISC rates surge on feeder and security costs: India Subcontinent trades continue to see rate increases, pushed higher by feeder realignments, elevated war risk insurance premiums, and strict compliance vetting across Middle Eastern hubs.
- Bunker surcharges locked in for September: Structural tightness in marine distillate fuels ensures Bunker Adjustment Factors (BAF) and Emergency Bunker Surcharges (EBS) will remain elevated across carrier invoices into upcoming Q3 billing cycles.
- Cape diversions protect rate floors: Permanent Cape of Good Hope routings continue to absorb 8% to 10% of global fleet capacity, preventing surplus tonnage from over-supplying Oceania lanes and preserving rate stability across European and North American trades.
Global schedule reliability
Global routing networks face compounded schedule instability in mid-August. While Cape of Good Hope diversions remain the established operational baseline—adding 10 to 14 days to Europe and North America trades—secondary shocks are driving severe berth congestion across Asian transshipment hubs. Weather-induced port closures from Super Typhoon Dolphin in Northeast Asia have created multi-day vessel backlogs and forced emergency blank sailings, while heavy Transpacific volume demand continues to drain empty equipment and feeder capacity out of Southeast Asia.
Below is the updated schedule reliability profile based on the latest platform tracking data and operational market changes:
Note: Transit times refer to ocean freight only and exclude inland transport, port handling, and customs clearance.
Key takeaways
- NE Asia operational slippage: Rated as High Risk due to severe weather disruptions from Super Typhoon Dolphin. Multi-day terminal suspensions across Shanghai, Ningbo-Zhoushan, and Qingdao have pushed berth waiting times to 3–7 days, triggering vessel bunching, missed feeder connections, and recovery blank sailings throughout August.
- SE Asia hub bottlenecks: Maintained at High Risk, driven by acute equipment competition from Transpacific export flows and heavy congestion at Singapore, Port Klang, and Ho Chi Minh transshipment hubs. Extended feeder connection delays are impacting origin-to-destination reliability.
- ISC & middle east exposure: Remains High Risk as dual chokepoint pressures (Hormuz compliance vetting and Bab el-Mandeb threats) force feeder realignments, altered rotation schedules, and heightened war risk oversight across regional transshipment hubs.
- Long-Haul cape baselines: European and North American routes maintain structured but extended transit windows reflecting permanent Cape of Good Hope diversions. Equipment tightness on eastbound Transpacific lanes is limiting carriers' ability to deploy extra-loader capacity on Oceania loops.
Australia
Australia

Operational performance across Australia's major container gateways remains generally steady heading into mid-August, though off-schedule vessel arrivals are generating localised landside friction. While East Coast ports are managing baseline import volumes, vessel bunching from recent East Asian typhoon disruptions is pushing Melbourne and Sydney empty container parks towards saturation. Adelaide and Fremantle continue to offer the most stable coastal operations, maintaining fluid berth access and manageable landside gate flows.
North East Asia
North East Asia

The Northeast Asia–Australia trade lane is navigating a mixed mid-August environment as carrier attempts to enforce August General Rate Increases (GRIs) meet varying degrees of market traction. While East Coast capacity improvements have caused spot rates to soften modestly from late-July peaks, ongoing weather disruptions across East China and severe congestion at key transshipment hubs are preventing a broader market drop. With pre-holiday Christmas inventory now entering the market, carriers continue to rely on blank sailings and port omissions to manage slot supply and defend market floors.
Ocean freight rates
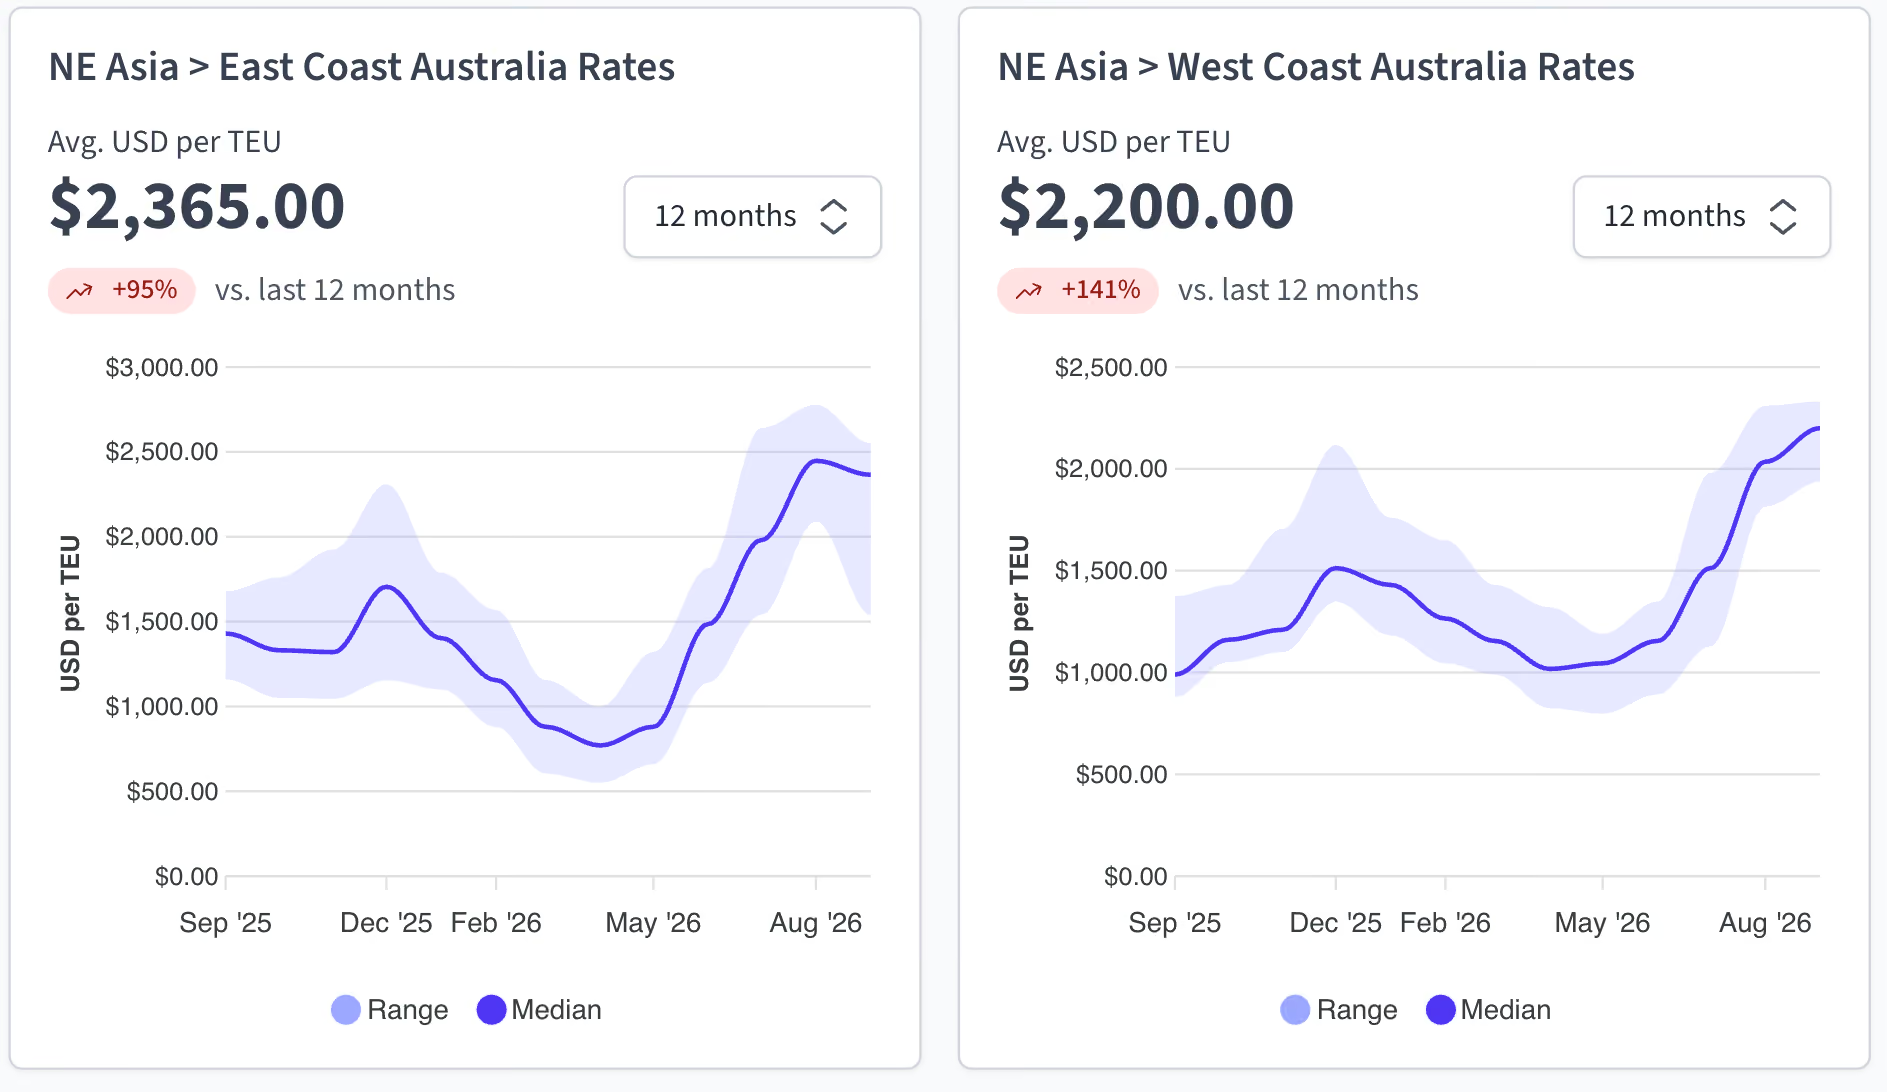
Ocean freight rates ex-Northeast Asia are experiencing a divided trend between Australian East Coast and West Coast destinations, with carriers attempting further rate hikes for late August.
Rate increases for the second half of August are effectively locked in, driven by a genuine capacity crunch including recent weather disruptions, geopolitical factors, and peak season demand. While initial GRI attempts saw mixed traction, these compounding pressures sustained upward momentum for mid-to-late August.
- Current rate benchmarks: Spot rates for containers ex-China hold between USD 2,200 and USD 2,700 per TEU.
- East vs. West Coast divergence: While East Coast pricing has softened modestly by USD 200–USD 400 per container from late-July peaks, West Coast (Fremantle) freight remains elevated due to severe transshipment congestion upstream in Singapore and Port Klang.
- Surcharges and local tariffs: Bunker Recovery Charges (BRC/BAF) remain firm at approximately USD 450 per TEU due to sustained marine distillate costs. Terminal Handling Charges (THC) and Detention & Demurrage (D&D) tariff revisions are taking effect across major carrier lines between mid-August and 1 September.
Capacity and schedule reliability
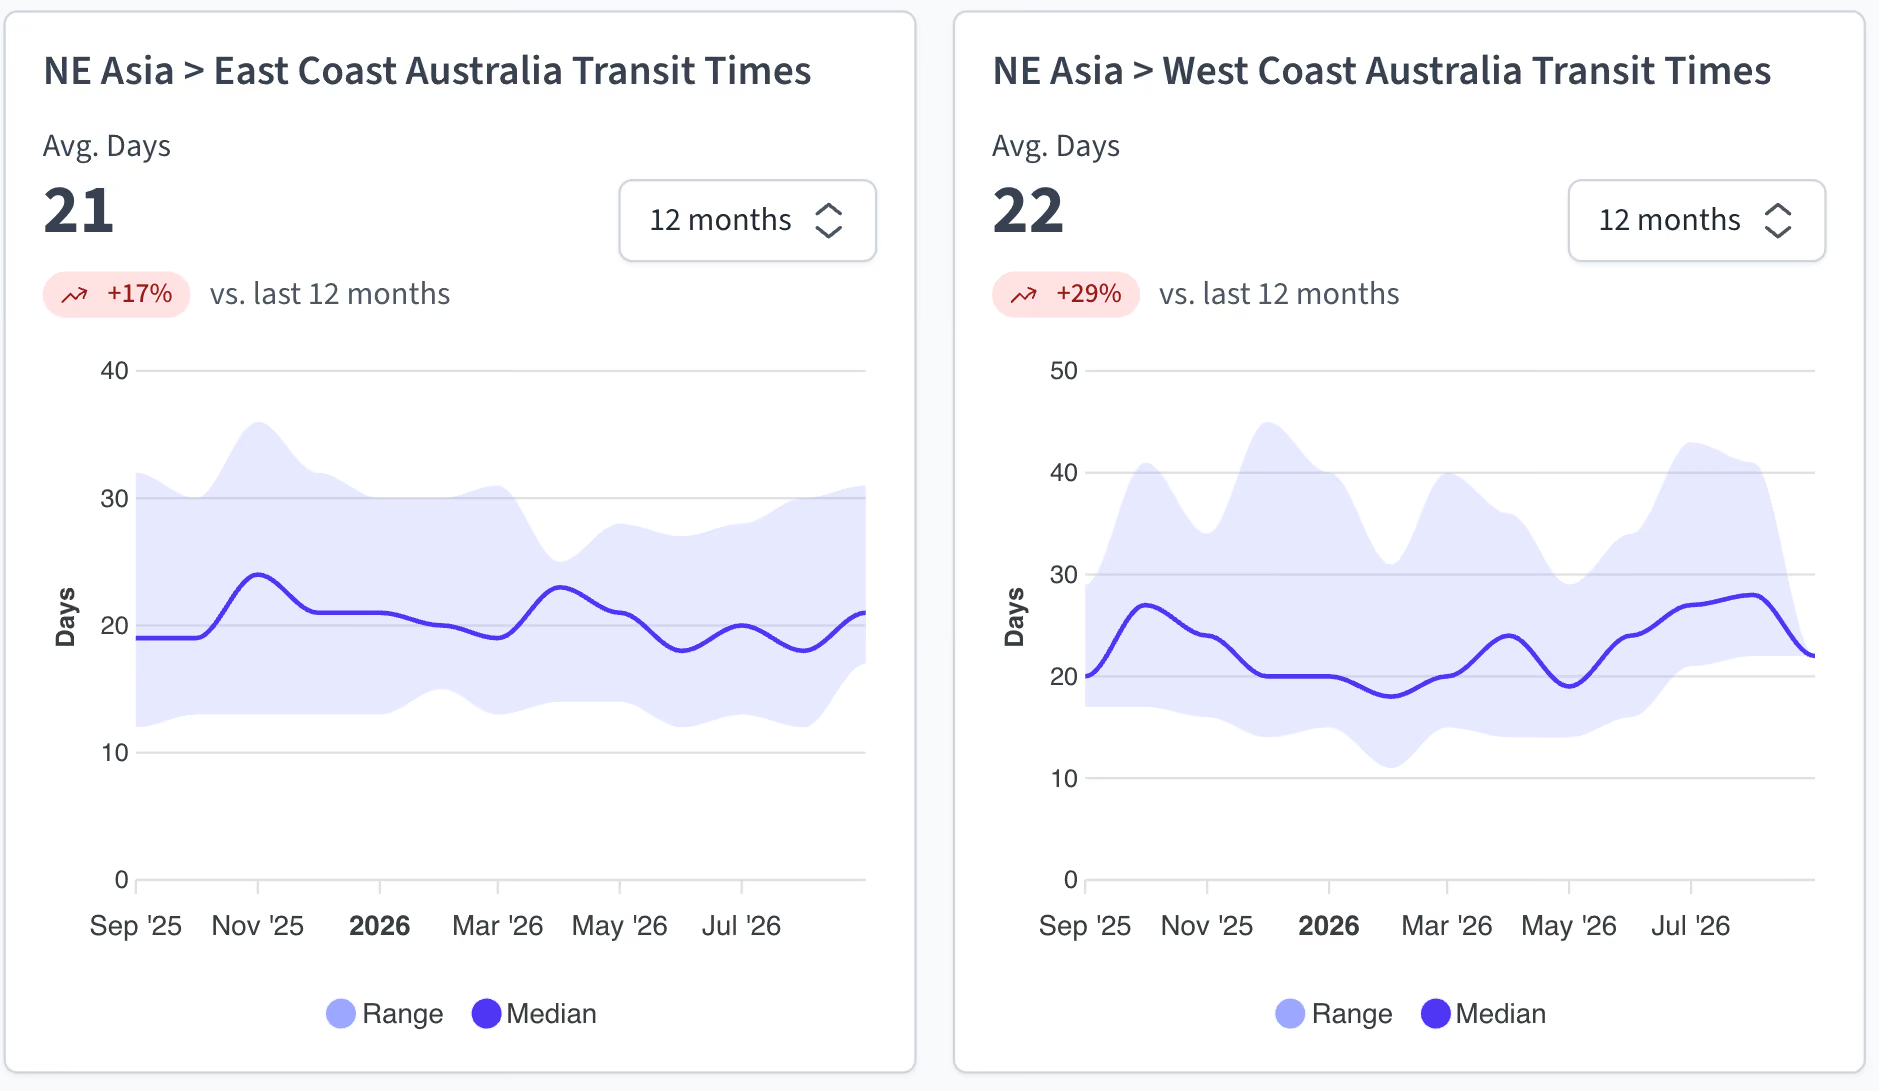
Schedule reliability remains under pressure due to typhoon-related port backlogs in East China and strategic carrier capacity management.
- Terminal Closures (Maritime): Major container terminals in Shanghai (Yangshan), Ningbo-Zhoushan, and Qingdao faced 48-to-72-hour closures. While gates have reopened, berth waiting times have surged to 3–7 days as vessels bunch at anchorages.
- Port congestion and omissions: Weather suspensions from Super Typhoon Dolphin across Shanghai, Ningbo-Zhoushan, and Qingdao have created vessel queuing. Carriers are actively omitting congested port calls to recover schedule integrity, transferring rolled cargo onto subsequent rotations.
- Intermodal Gridlock: Heavy flooding in Zhejiang and Jiangsu provinces has disrupted feeder barge services and inland trucking corridors, further restricting the flow of export containers to port-side staging areas.
- Transit time variances: Standard direct port-to-port transit times from main Northeast Asian hubs (Shanghai, Ningbo, Shenzhen) to East Coast Australia range from 11 to 19 days. However, typhoon backlogs and port omissions are extending total ocean lead times to 22–26 days on affected loops.
- Capacity discipline: Ocean lines continue to utilise blank sailings and service adjustments on key loops (including A3 and local feeder services) to keep vessel utilisation high and counter softer-than-expected early peak season demand.
- Equipment availability: Standard 20ft and 40ft dry equipment levels across main Chinese ports are generally adequate. However, 40HC equipment remains tight in secondary Chinese feeder ports due to heavy Transpacific repositioning.
Air Freight
Air freight markets across Northeast Asia remain supported by sustained non-general cargo demand, keeping capacity tight into Q3.
- Operational weather disruptions: Temporary flight cancellations and tarmac suspensions at Shanghai Pudong (PVG) and Hong Kong (HKG) due to severe typhoon weather caused short-term cargo backlogs, though terminal operations have since normalised.
- Flight Cancellations (Air): Shanghai Pudong (PVG) and Hangzhou (HGH) reported over 450 cancelled freighter and passenger-belly flights. Tarmac congestion and ground handling delays are expected to persist through the upcoming week.
- Strong sectoral demand: Outbound air cargo volumes from China, Hong Kong, South Korea, and Taiwan remain strong, driven primarily by direct-to-consumer e-commerce platforms, technology hardware, semiconductors, and AI-related equipment shipments.
- Bellyhold and freighter capacity: Additional passenger flights on intra-Asia and long-haul routes have expanded bellyhold capacity, though high-volume e-commerce allocations continue to restrict spot freighter space, requiring 1-to-2-week advance booking windows.
- Eased general cargo rates: Air freight spot rates for general cargo ex-China to Australia have moderated slightly to USD 3.50–USD 4.50 per kg (1,000kg+ tier), providing an accessible option for urgent sea freight conversions.
South East Asia
South East Asia
.avif)
South East Asian logistics hubs (Singapore, Malaysia, Vietnam, Thailand, and Indonesia) enter mid-August under sustained operational friction. Major transshipment hubs—primarily Singapore and Port Klang—continue to absorb off-schedule mainline vessel arrivals resulting from Cape of Good Hope diversions and recent East China typhoon backlogs.
Concurrently, a surge in early Transpacific peak-season demand is draining 40ft/40HC empty container inventory away from regional feeder networks to service US-bound trades.
Ocean freight rates
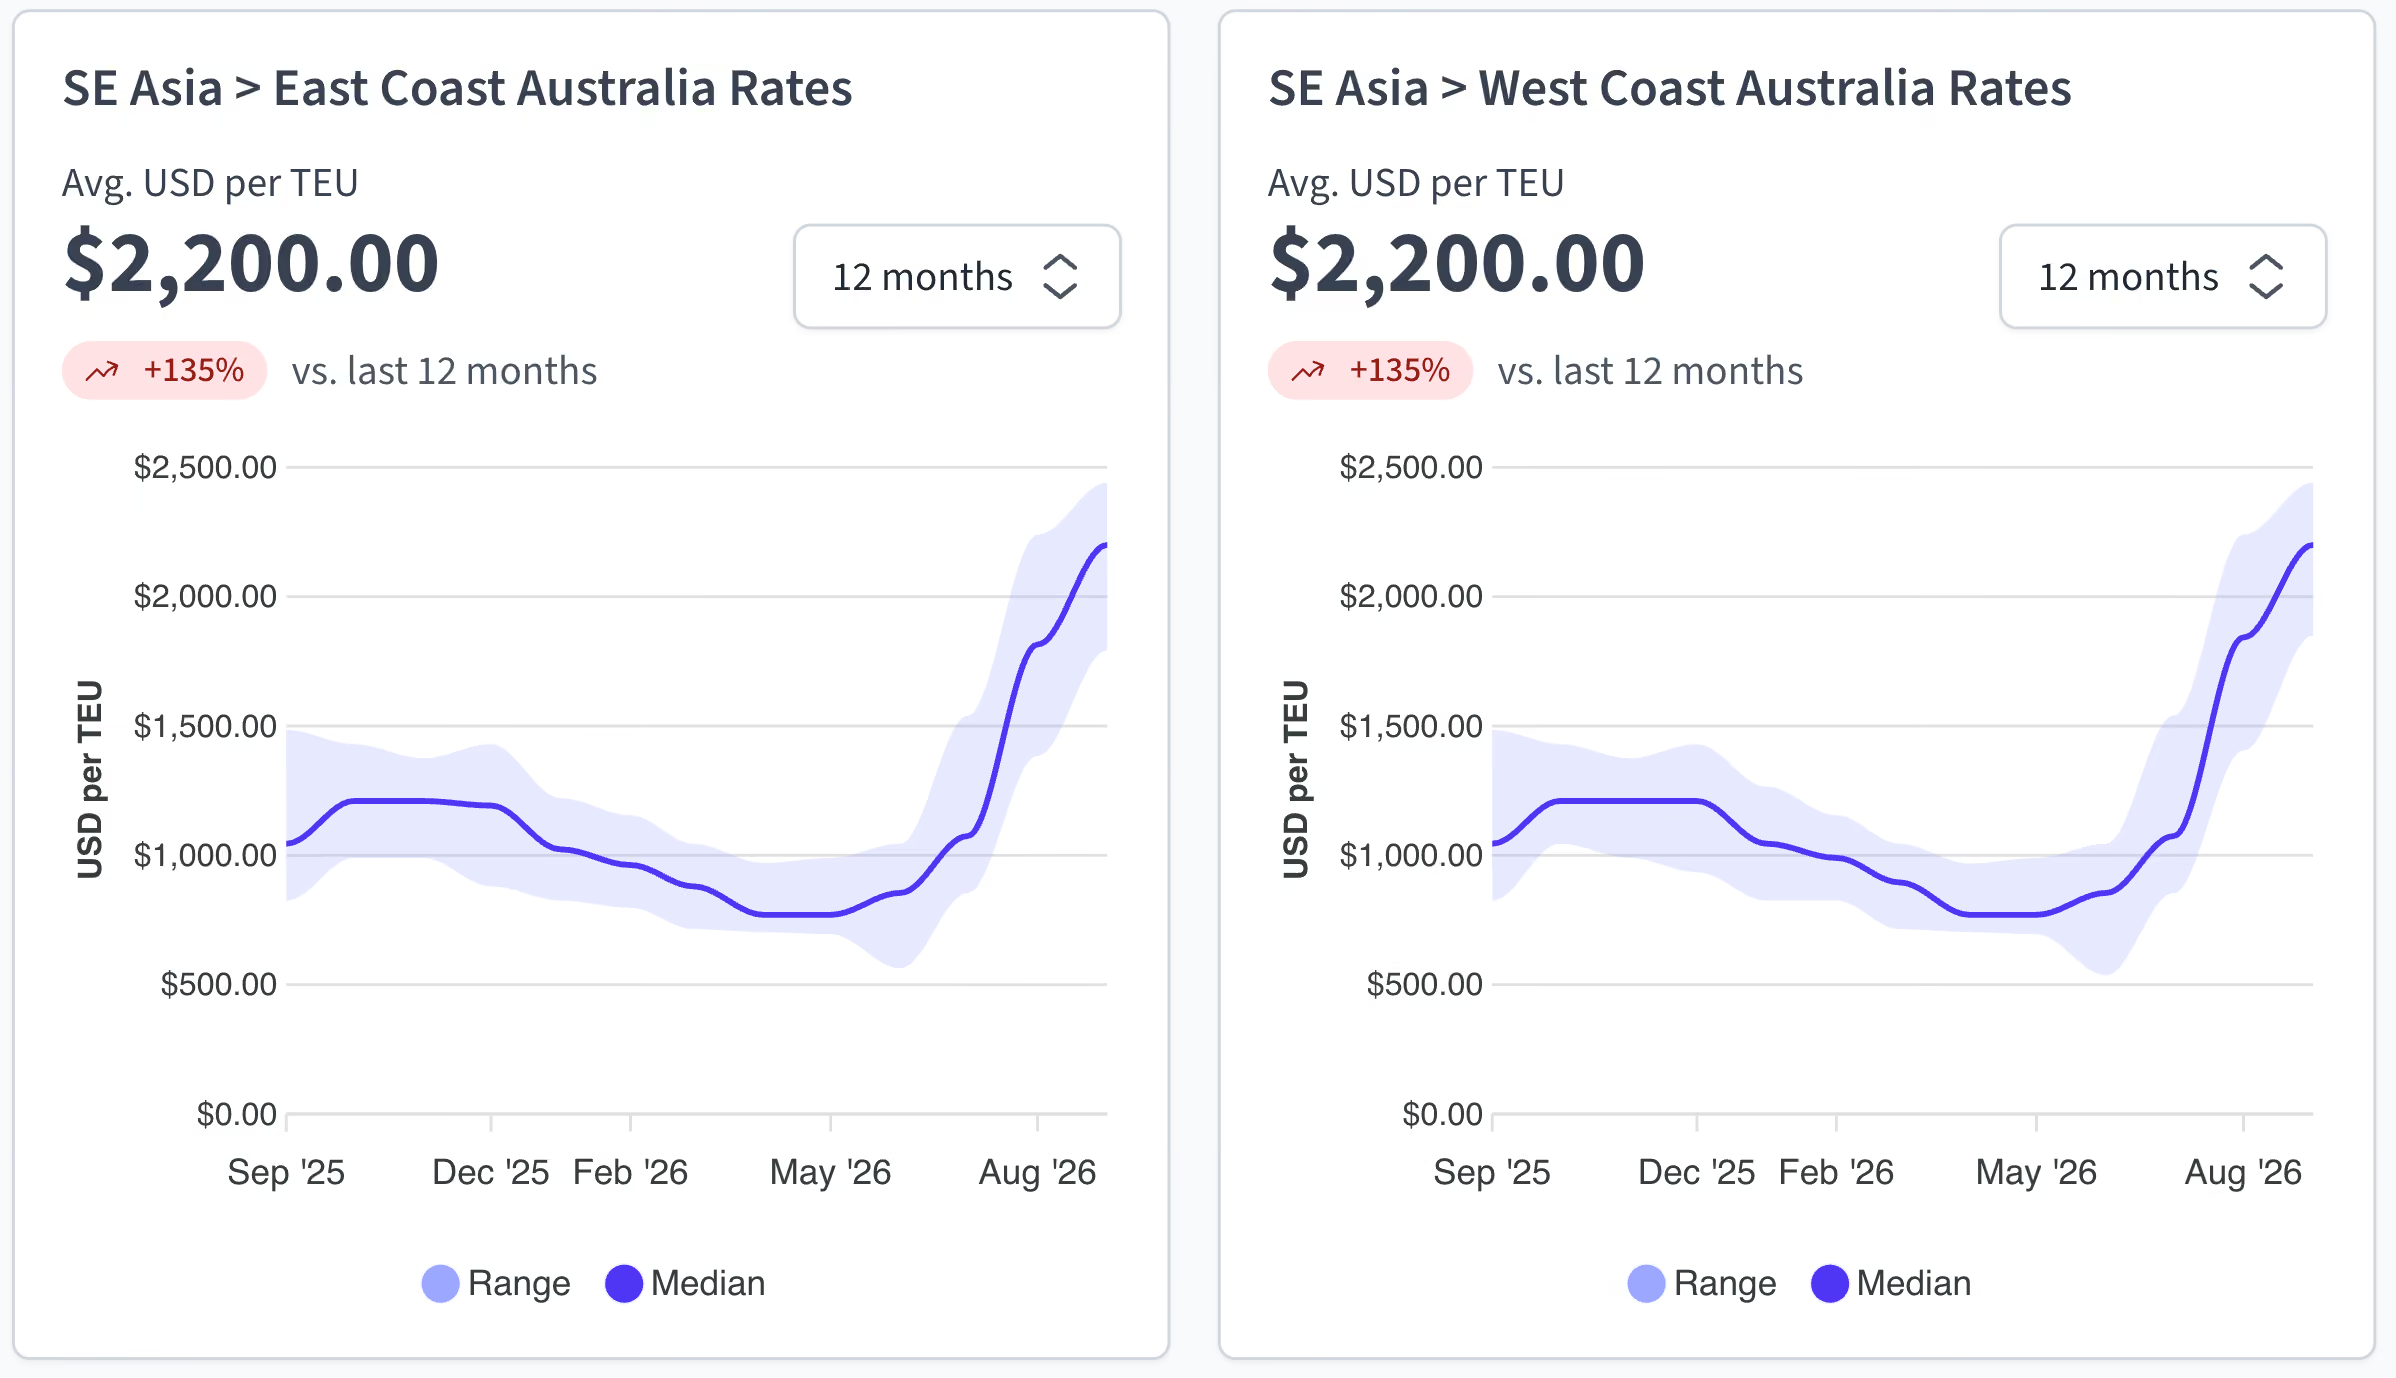
Unlike Northeast Asian trades where spot rates have tested a floor, ocean freight rates ex-South East Asia to Australia continue on an upward trajectory driven by transshipment bottlenecks and equipment competition.
- Rate restoration movements: Mainline carriers (including ANL, CMA CGM, and MSC) have announced Rate Restorations across South East Asia–to–Australia trade lanes of USD 500 per 20ft and USD 1,000 per 40ft, effective mid-August and 1 September.
- Current rate benchmarks: Spot rates for containers ex-South East Asia main hubs to Australian East Coast ports sit between USD 2,200 and USD 2,400 Per TEU (Mid-Tier), with Premium tiers reaching USD 2,700 Per TEU.
- Transshipment and equipment premiums: Shipments originating from feeder ports in Vietnam (Ho Chi Minh, Haiphong) and Thailand (Laem Chabang) carry a USD 150–USD 300 per container equipment supply surcharge due to acute regional 40HC shortages.
- Bunker and peak surcharges: Bunker Adjustment Factors (BAF) remain firm across all regional loops, while carriers are selectively enforcing Peak Season Surcharges (PSS) on non-contracted spot bookings to prioritise higher-yield cargo.
Capacity and schedule reliability
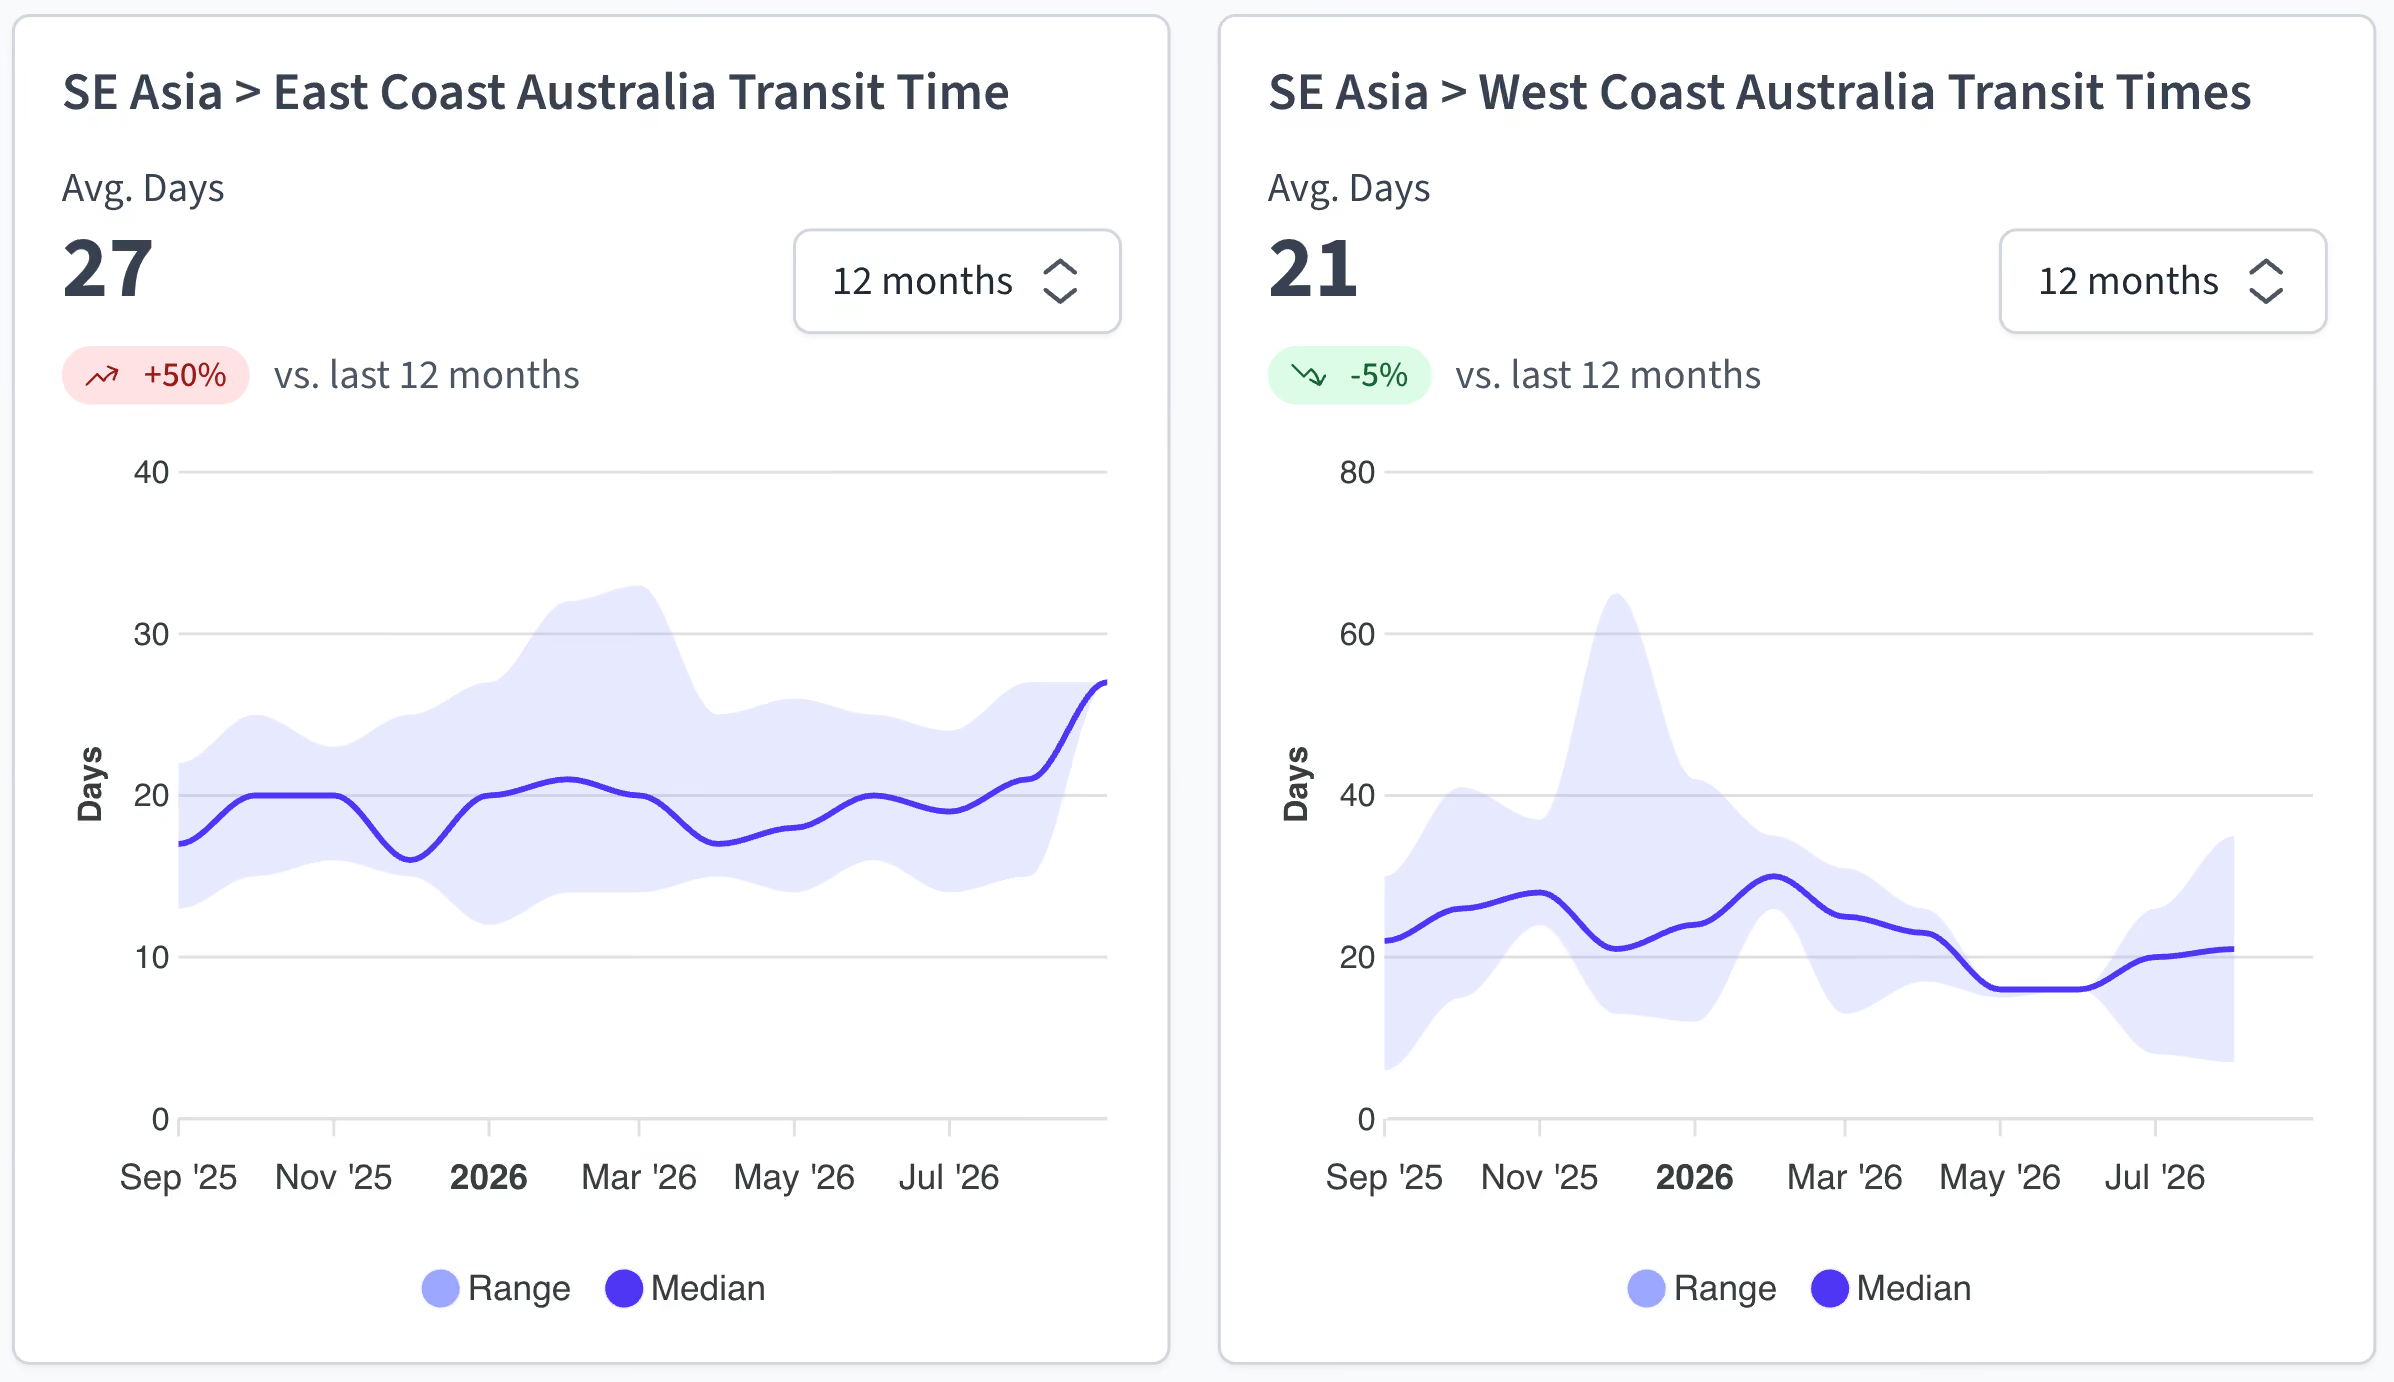
Schedule reliability across South East Asian trade lanes remains classified as High Risk, with connection delays at primary transshipment hubs serving as the main operational bottleneck.
- Transit Time Variances: Direct port-to-port sailings from Singapore or Port Klang to Australian East Coast hubs range between 10 and 18 days (10–12 days to Fremantle). However, transshipment routes originating in Vietnam, Thailand, or Indonesia face extended total transit times of 20 to 28 days due to feeder connection slippage.
- Hub Congestion & Feeder Dwell: Yard utilisation at Singapore and Tanjung Pelepas remains elevated (80%–85%). Average feeder dwell times at Singapore and Port Klang sit at 3 to 5 days, increasing connection rollover risks for cargo transferring onto southbound Oceania loops.
- Equipment Tightness: Equipment availability—particularly 40HC and reefer units—is severely constrained across Vietnamese and Thai export gateways as ocean lines prioritise box positioning toward high-yielding Transpacific routes.
- Capacity Discipline: Carriers are maintaining strict slot allocations on direct Australia services, leveraging blank sailings and port omissions on feeder legs to align capacity with high-tier freight.
Air Freight
Air freight markets across South East Asia remain firm into mid-August, with tightening capacity, rising rates, and active carrier yield management compressing available uplift into Australian gateways.
- Capacity constraints and destination pressure: Outbound capacity across major hubs (Singapore, Kuala Lumpur, and Bangkok) is tightening due to ocean-to-air conversions, with Sydney and Melbourne facing the heaviest spot allocation constraints and strict weight caps.
- Rising rates and strict yield management: Freight rates continue on an upward trajectory ex-Ho Chi Minh City, Bangkok, and Singapore as airlines strictly manage cargo profiles, prioritise smaller high-yield shipments, and limit main-deck freighter allocations.
- Operational and network disruptions: Regional transit times face friction from fuel-related payload restrictions, reduced secondary freighter frequencies, and second-leg connection delays caused by incoming long-haul flight slippage.
- Baseline stability and contingency options: Passenger belly-hold capacity on premium Australian routes and non-prime economy products remain stable, complemented by dedicated Explorate ULD allocations out of Singapore and Kuala Lumpur hubs for time-critical cargo.
India Subcontinent
India Subcontinent
.png)
The Indian Subcontinent logistics corridor enters mid-August navigating severe operational complexity, driven by localised landside gridlock, monsoon disruptions, and secondary flow-on impacts from Middle Eastern maritime realignments. Nhava Sheva (JNPA) remains a critical flashpoint following transport association protests over private yard Lift-On/Lift-Off (LOLO) charges, which have restricted empty container returns and severely impacted export equipment availability. Compounding this, heavy South-West monsoon rains across Western and Eastern Indian ports (Nhava Sheva, Mundra, Chennai) are causing operational suspensions, inland rail (CONCOR) rake shortages, and road transport delays.
Transshipment networks serving the region are under equal strain. Colombo Port—a vital transshipment hub for South India and Bangladesh exports to Australia—faces heavy yard congestion and inter-terminal transfer delays due to Middle East vessel diversions, extending transshipment dwells by 7 to 14 days. Meanwhile, Bangladesh export corridors through Chittagong remain disrupted by 6-to-8-day berth queues and inland rail bottlenecks, creating severe lead-time volatility for apparel and retail shippers.
Ocean spot rates ex-India to Australia remain firm on an upward trajectory, supported by carrier blank sailings and port omissions. With heavy transshipment congestion lingering at Singapore and Port Klang, cargo rolling risks remain high, pushing total ocean lead times to an unreliable 18 to 28 days.
Air Freight
Air freight markets across the India Subcontinent remain tight into mid-August, with elevated rates, constrained space, and active carrier yield management compressing uplift availability into Australian gateways.
- Space constraints and destination pressure: Capacity remains tightly compressed across major regional gateways (Delhi, Mumbai, Dhaka, and Colombo), with cargo bound for Melbourne and Brisbane facing the most acute space pressure, strict weight limits, and weekend uplift bottlenecks.
- Structurally elevated rates and yield prioritisation: Spot and contract rates remain high as airlines conservatively manage space, actively prioritising high-yielding cargo and subjecting late bookings to severe rollover risks or steep spot premiums.
- Transshipment and operational disruptions: Dynamic reroutings and second-leg connection delays through Middle Eastern and secondary Asian transshipment hubs continue to disrupt transit consistency, compounded by frequent airline flight schedule adjustments due to volatile fuel costs.
- Baseline capacity and contingency solutions: Core passenger belly-hold capacity on primary trunk routes into eastern Australia remains stable, complemented by localised forwarder blocked space agreements (BSAs) and multi-stop economy air products that provide cost stability for non-urgent shipments.
North America
North America

Market conditions ex-North America into Australia remain balanced, though operational pressure and schedule disruptions persist across ocean and inland intermodal networks. Import volumes across major North American gateways are surging earlier than historical norms, heavily driven by shifting Transpacific trade dynamics. According to Vizion TradeView booking data, Vietnam-to-US container bookings have jumped +19.2% year-over-year in 2026, powered by an early peak season that recorded nine consecutive weeks above 60,000 TEU (peaking at 70,335 TEU). With Southeast Asian trade rerouting accelerating as China-to-US volumes soften, US West Coast and East Coast ports are absorbing a heavy front-loaded inventory surge as importers hedge against late-Q3 bottlenecks.
For ocean cargo moving ex-North America into Oceania, service dynamics vary significantly by route structure:
- Direct West Coast Loops: Direct services ex-USWC (Los Angeles, Long Beach, Oakland, Seattle) to Australian East Coast ports hold steady at 26–32 days transit, though vessel schedule reliability has dropped by 5 to 8 days due to West Coast port bunching.
- Transshipment via Asia: Secondary transshipment options routed via Asian hubs (Busan, Shanghai, Singapore) stretch total lead times to 40–50 days, making them highly vulnerable to regional feeder delays.
- Canadian Intermodal Rail: Canadian export flows via Vancouver and Prince Rupert face rail dwell friction across CN and CPKC intermodal yards, creating drayage and equipment availability lead-time delays for Canadian lumber, agricultural machinery, and paper products.
Biosecurity Compliance Notice: With the 2026–2027 Brown Marmorated Stink Bug (BMSB) season commencing 1 September, target high-risk goods (machinery, vehicles, tools) originating from both the USA and Canada face mandatory offshore treatment (heat treatment or methyl bromide fumigation) and strict adherence to the 120-hour post-treatment container sealing rule. Shipments departing target North American ports without approved offshore treatment face mandatory re-export or re-direction upon arrival in Australia.
Air Freight
Air freight conditions ex-North America into Australia remain compressed into mid-August, driven by elevated jet fuel surcharges and airline payload restrictions that continue to limit spot uplift into Australian gateways.
- Gateway capacity and destination pressure: Outbound capacity across major gateways (Los Angeles, New York, Chicago, Vancouver, and Toronto) remains tight due to prioritised tech-sector volume allocations, with Sydney and Melbourne facing the heaviest spot space restrictions and strict weight caps.
- Rate trajectory and yield management: Freight rates ex-US and Canadian gateways continue on an upward trajectory, with carriers strictly managing weight breaks, prioritising smaller high-yield shipments, and allocating main-deck freighter space on a case-by-case basis.
- Network and transshipment disruptions: Long-haul flight payload adjustments and second-leg connection delays through Asian and Middle Eastern transshipment hubs continue to cause lead-time volatility for multi-stop air cargo bound for Australia.
- Belly-hold baseline and BSA options: Core passenger belly-hold capacity on direct Transpacific routes remains stable, supplemented by forwarder blocked space agreements (BSAs) and dedicated ULD allocations out of West Coast hubs to ensure baseline transit reliability.
Europe
Europe
.png)
The Europe–Australia logistics corridor continues to operate under structural complexity into mid-August, primarily governed by sustained Cape of Good Hope diversions that add 10 to 14 days to standard transit loops. While European export spot rates have softened slightly from early-summer peaks, operational friction across inland waterway networks—notably water level fluctuations along the Rhine river restricting barge capacities—is shifting cargo onto rail and drayage corridors, creating localised congestion at main gateways including Rotterdam, Antwerp, and Hamburg.
For Australian importers, DAFF's official 2026–2027 Brown Marmorated Stink Bug (BMSB) measures (commencing 1 September) introduce critical policy updates:
- New Onshore Treatment: Ethyl Formate has been approved as an additional onshore treatment option for eligible cargo.
- Discontinued Schemes: The Safeguarding Arrangement Scheme and the Rolled Goods Policy have been officially removed for 2026–2027.
- Geographic Scope: Target high-risk goods originating from continental Target Risk Countries (Germany, Italy, France, Spain, Netherlands, Belgium, etc.) require mandatory offshore treatment and adherence to the 120-hour sealing rule. Consignments originating strictly from the United Kingdom are exempt from target risk country measures unless transshipped through a target risk country.
Ocean freight rates
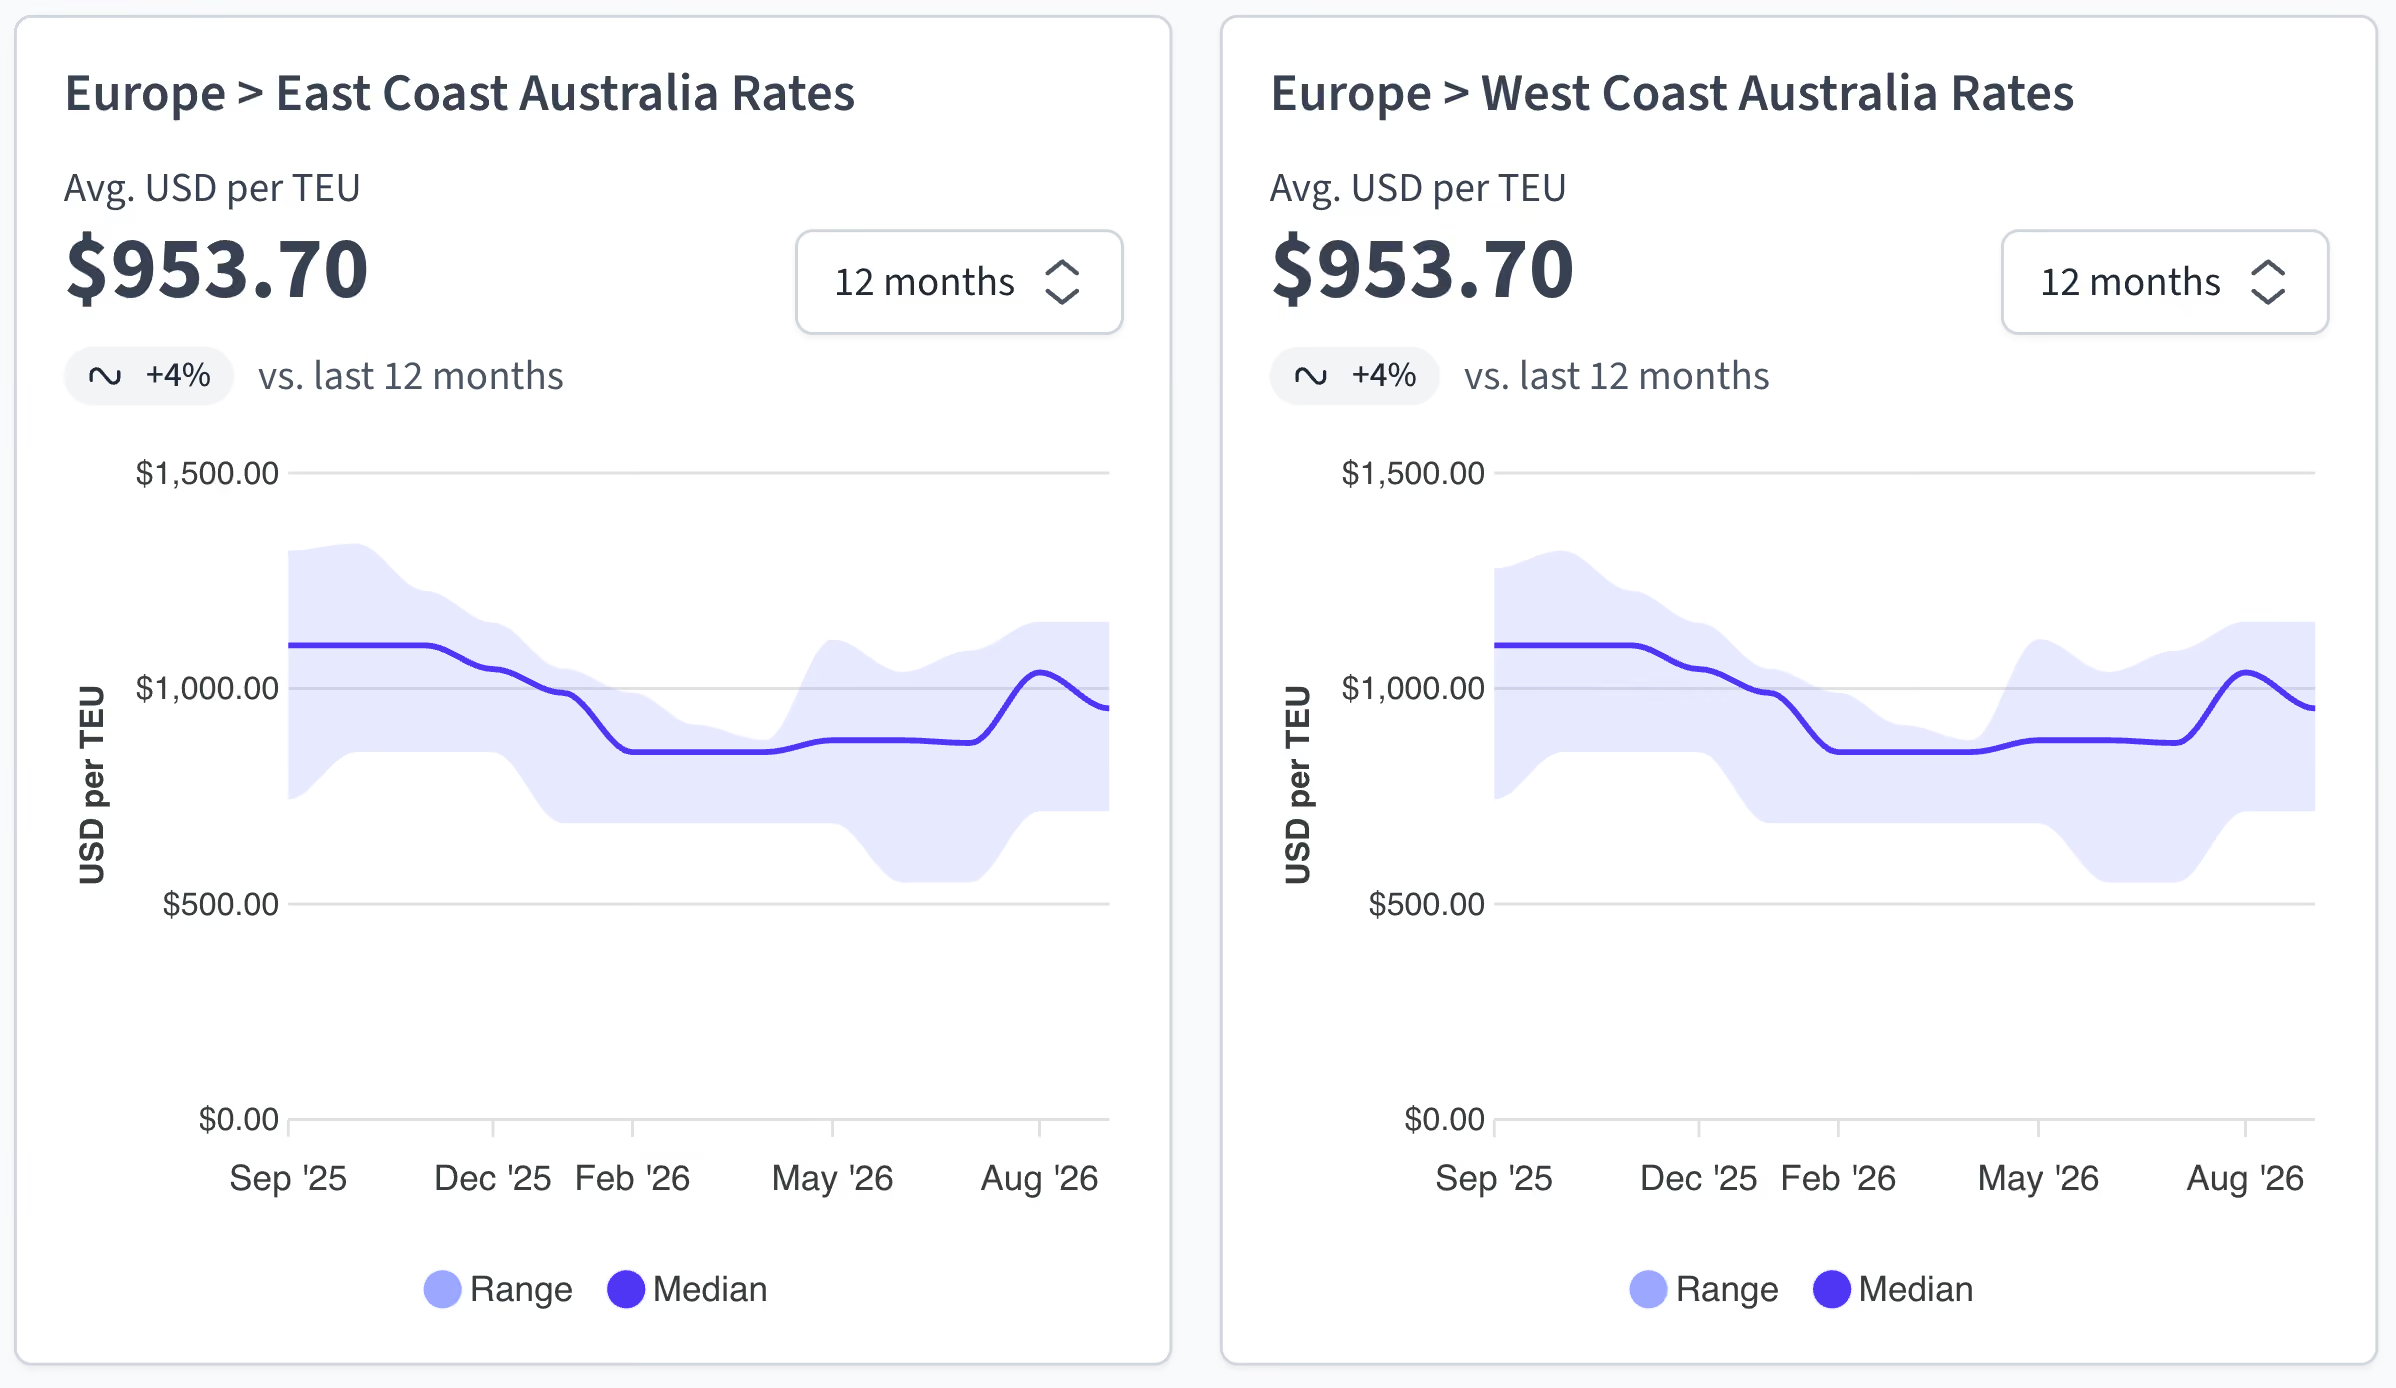
Ocean freight rates ex-Europe and the Mediterranean to Australia remain structurally elevated due to extended routing distances and embedded carbon surcharges, though spot levels have tested a minor ceiling in mid-August.
- Current rate benchmarks: Spot rates for 20GP containers ex-Northern Europe main hubs (Rotterdam, Hamburg, Antwerp) to Australian East Coast ports hold steady between USD 1,200 and USD 2,000 per TEU. Mediterranean origins (Genoa, Barcelona, Valencia) sit at similar levels with minor transshipment feeder surcharges.
- Carbon and operational surcharges: EU Emissions Trading System (EU ETS) carbon taxes and Emergency Operational Surcharges linked to Cape reroutings remain fully incorporated into carrier base tariffs, preventing significant freight cost reductions.
- Peak season and restoration attempts: Ocean lines are flagging mid-to-late August Rate Restorations and Peak Season Surcharges (PSS) across Europe–Oceania loops to defend vessel yield margins as pre-holiday manufacturing output ramps up.
- Equipment supply surcharges: While standard 20ft and 40ft dry containers are generally available across main European export gateways, specialized equipment (open tops, flat racks, and reefer units) carries premium equipment positioning surcharges.
Capacity and schedule reliability
Schedule reliability on Europe-to-Australia loops remains heavily impacted by long-distance vessel rerouting around Africa and Mediterranean transshipment congestion.
- Extended Transit Windows: Port-to-port ocean transit times ex-Northern Europe to Australian East Coast gateways range between 42 and 55 days via Cape routing, compared to pre-crisis historical averages of 30 to 35 days.
- Inland Barge & Rail Friction: Reduced draft limits on key European inland waterways (such as the Rhine) have restricted container barge payloads, increasing reliance on intermodal rail and truck drayage into Rotterdam and Antwerp, extending landside lead times.
- Mediterranean Hub Dwell: Major Mediterranean transshipment hubs (Algeciras, Gioia Tauro, Piraeus) remain heavily utilized for carrier loop swaps and regional feeder connections, resulting in feeder dwell times of 4 to 7 days for regional exports.
- Biosecurity Compliance Timelines: DAFF's removal of the Safeguarding Scheme and Rolled Goods Policy for the 2026–2027 BMSB season requires strict alignment between supplier packing dates, offshore treatment providers, and carrier Shipped-on-Board dates to prevent mandatory onshore re-export.
Air Freight
Air freight markets ex-Europe into Australia remain compressed heading into mid-August, driven by high jet fuel surcharges, Middle Eastern airspace transit constraints, and active airline yield management.
- Gateway capacity constraints: Outbound capacity across major European gateways (Frankfurt, London Heathrow, Paris CDG, and Amsterdam) remains tight into Australian destinations, with Sydney and Melbourne experiencing the heaviest spot allocation pressure.
- Structurally elevated rates: Spot and contract rates ex-Europe hold firm as airlines actively manage space, prioritising high-yield pharmaceutical, automotive, and technology shipments over standard general cargo.
- Transshipment connection slippage: Multi-leg air cargo routed via major Middle Eastern hubs (Dubai, Doha, Abu Dhabi) faces ongoing transit time variability due to payload restrictions and second-leg connection delays.
- Selective main-deck space allocation: Airlines and freighter operators continue to restrict cargo profile allowances, strictly managing weight breaks and vetting out-of-gauge or heavy main-deck allocations on a case-by-case basis.
- Passenger belly-hold stability: Direct and single-connect passenger belly-hold capacity on European trunk carriers remains steady, providing reliable baseline uplift for standard consolidation shipments.
- Secured ULD & BSA contingency options: Dedicated forwarder Blocked Space Agreements (BSAs) and secured ULD capacity out of Frankfurt and London offer reliable uplift options for time-critical or high-margin freight.
Key takeaways
.avif)
Experienced Business Development Manager with a demonstrated history of working in the logistics and supply chain industry. Skilled in Import/Export, Freight Transportation, Freight, Warehouse Operations, and Overseas Networking.
- ACA International / DACHSER (August 2026). Ocean Freight Rate Restoration Announcement – Asia & South East Asia to Australia. Melbourne: ACA International Official Website.
- Air Cargo News (August 2026). South East Asia Air Cargo Capacity, Yield Management & Regional Hub Performance. London: Air Cargo News Official Website.
- Air Cargo World (August 2026). North America to Oceania Air Tonnage, Spot Rates & Carrier Yield Dynamics. Seattle: Air Cargo World Official Website.
- ANL Container Line (August 2026). Trade Notice: Asia to Australia Rate Restoration Effective 1 September 2026. Melbourne: ANL Official Website.
- Container News (August 2026). India to Australia Ocean Freight Rates, GRI Enforcement & Transshipment Dwell Times. London: Container News Official Website.
- Container Transport Alliance Australia (CTAA) (August 2026). National Landside Logistics, VBS Slot Allocation & Empty Container Park Operational Bulletin. Melbourne: CTAA Official Website.
- Department of Agriculture, Fisheries and Forestry (DAFF) (August 2026). 2026–2027 Seasonal Measures for Brown Marmorated Stink Bug (BMSB) & Import Industry Advice Notice 138-2026. Canberra: DAFF Official Website.
- Explorate (August 2026). China to Australia Ocean Rates, Transit Times & Market Intelligence Dashboard. Brisbane: Explorate Official Website.
- Flinders Ports (August 2026). Port Adelaide Outer Harbor Container Terminal Operational Summary. Adelaide: Flinders Ports Official Website.
- Fremantle Ports (August 2026). Port Operations, Vessel Wait Times & Landside Interface Updates. Fremantle: Fremantle Ports Official Website.
- Journal of Commerce (JOC) / S&P Global (August 2026). Global Port Congestion, Intermodal Dwell Times & JNPA Terminal Operations Snapshot. London: JOC Official Website.
- NSW Ports (August 2026). Port Botany Operations & Terminal Berthing Performance Report. Sydney: NSW Ports Official Website.
- Port of Brisbane Pty Ltd (PBPL) (August 2026). Trade Performance & Terminal Operations Report. Brisbane: Port of Brisbane Official Website.
- Port of Melbourne (August 2026). Monthly Trade Performance & Terminal Operational Results. Melbourne: Port of Melbourne Official Website.
- Portcast (August 2026). Real-Time Port Congestion & Vessel Dwell Metrics: Singapore & Port Klang. Singapore: Portcast Official Website.
- STAT Trade Times (August 2026). Air Cargo India & South Asia Market Performance Snapshot. Mumbai: STAT Trade Times Official Website.
- TCF International / Freight & Trade Alliance (FTA) (August 2026). 2026/27 Brown Marmorated Stink Bug (BMSB) Seasonal Measures Confirmed. Sydney: FT Alliance Official Website.
- The Maritime Executive (August 2026). Indian Subcontinent Feeder Networks & Middle East Maritime Flow-On Analysis. Vero Beach: Maritime Executive Official Website.
- Tradlinx (August 2026). Global Port Congestion Briefing & Asian Transshipment Hub Performance Snapshot. Seoul: Tradlinx Official Website.
- Vizion TradeView (August 2026). Vietnam to US Container Bookings Up 19% YoY in 2026: Transpacific Trade Reshuffling & Early Peak Season Analysis. Atlanta: Vizion API Official Website.
- WorldACD Market Data / IATA (August 2026). Weekly Global Air Cargo Tonnage, Spot Rates, Jet Fuel Surcharges & Regional Yield Tracking. Amsterdam: WorldACD Official Website.
Frequently Asked Questions
Explorate gives supply chain managers one real-time view across ever forwarder, lane and mode without replacing your current process, partners or systems.

