
What’s happening in global freight
Global supply chains enter mid-September navigating pre-Golden Week volume surges, compound typhoon disruptions, and tight charter market capacity. Cape of Good Hope reroutings combined with North Asian port backlogs continue to absorb effective fleet capacity.
- Pre-golden week cargo rush: Ocean carriers are experiencing an influx of early bookings as shippers accelerate factory releases ahead of the Golden Week factory closures in China (1–7 October). Carriers are leveraging this demand to enforce mid-to-late September Rate Restorations and mitigate spot rate softening.
- Factories typically begin slowing production from late September, with labour and trucking shortages becoming more prevalent from around 24 September. Some factories may also close ahead of the official Golden Week holiday period.
- Plummeting Schedule Reliability: Sea-Intelligence data reveals global schedule reliability experienced its sharpest single-month drop since January 2021, falling 6.1 percentage points to 56.4%, with average vessel delays expanding to 6.06 days.
- Severe Port Congestion & Typhoon Fallout: Compound typhoons (including Typhoon Saudel) have severely disrupted East Asian gateways. Linerlytica estimates 3.92 million TEU (11% of the global fleet) is tied up in port logjams globally, with North Asia accounting for 54% (~2.5 million TEU) of all vessels queuing.
- Charter Market Squeeze: Vessel availability remains constrained as newbuilding deliveries hit a 3-year low of 64,640 TEU, keeping charter rates elevated and limiting carrier ability to inject extra-loader capacity.
- BMSB biosecurity regulations active: The 2026–2027 Brown Marmorated Stink Bug (BMSB) risk season officially took effect on 1 September across all target risk countries in North America and Europe. Importers face strict enforcement of mandatory offshore treatment for target high-risk goods, adherence to the 120-hour post-treatment container sealing rule, and the complete phase-out of the Safeguarding Scheme and Rolled Goods Policy.
- Air Freight Capacity Tightening: Air freight space is beginning to tighten as demand builds from tech exports, Southeast Asian e-commerce, and ocean-to-air conversions. Available capacity into Eastern Australia is becoming more constrained, placing upward pressure on spot rates and increasing the importance of securing space early.
Global freight rates
Global container freight rates enter mid-September in a divided state. While global benchmark indices (such as the Drewry World Container Index at ~$4,473/FEU) show a minor 1%–2% softening from early-summer peaks, rates across primary East-West and Asia-Oceania trade lanes remain structurally elevated. Importers front-loading peak-season inventory ahead of China's Golden Week (1–7 October) and ongoing Cape of Good Hope reroutings are maintaining strong carrier pricing power.
Key takeaways
- Asian Origin Elevation & Carrier Rate Pushes: Upward pricing momentum across North East Asia, South East Asia, and Indian Subcontinent corridors (+8% to +15% month-over-month) is driven by a pre-Golden Week demand rush combined with tactical capacity management. By stacking blank sailings against accelerating factory releases, ocean lines have artificially tightened vessel utilisation, generating the market leverage required to enforce mid-to-late September Rate Restorations and reverse recent spot rate softening.
- Transpacific Rate Premiums & Coastal Spread: Transpacific spot rates remain structurally elevated at +280% to +300% above pre-crisis baselines. US East Coast routes continue to command a 35% to 40% premium over US West Coast options as cargo owners actively hedge against Panama Canal transit restrictions and potential landside disruptions, preserving strong carrier yields.
- Plateaued Base Rates vs. Inflated Landed Overhead: Ocean base rates ex-North America and Europe have reached a pricing ceiling as macro demand normalises. However, total landed costs remain high due to compounding surcharges—namely sustained Cape of Good Hope diversions, EU ETS carbon compliance fees, active BMSB biosecurity overheads, and inland fuel surcharges (up to +8.3% on rail).
- Capacity Absorption & Strategic Premium Tiering: With Cape diversions absorbing 8% to 10% of global fleet capacity and typhoon-related port backlogs locking up an additional 11% (~3.92M TEU), spot allocations remain severely constrained. This has driven a $500–$800/TEU spread between Budget and Premium tiers, forcing shippers to trade up to space-guaranteed products to mitigate connection rollover risks.
Global schedule reliability
Global routing networks enter mid-September facing severe, multi-region schedule degradation. Global schedule reliability has dropped to 56.4%—its lowest level in over two years—with average vessel arrival delays stretching past 6 days. Beyond the established operational baseline of Cape of Good Hope diversions, supply chains are contending with severe secondary disruptions: the aftermath of Typhoon Saudel in North Asia tying up 3.92 million TEU (11% of global fleet capacity) in port logjams, empty-container yard strikes at Mundra (India), and compounding port and rail stoppages across Northern Europe (Hamburg and Rotterdam).
Below is the updated schedule reliability profile based on the latest platform tracking data and operational market changes:
Note: Transit times refer to ocean freight only and exclude inland transport, port handling, and customs clearance.
Key takeaways
- Asian Gateway Bottlenecks (NE Asia, SE Asia & ISC): Severe origin congestion across Asian hubs is being driven by distinct localized shocks—the post-Typhoon Saudel backlog in Shanghai and Ningbo (6–10 day berth delays) combined with the MECYASA yard strike at Mundra (~5,000 TEU/day held up). This is crippling feeder reliability and triggering widespread transshipment rollovers in Singapore and Port Klang.
- European Intermodal Stoppages (Europe): While ocean blank sailings remain moderate, effective export capacity out of Northern Europe is severely constrained. Warning strikes by German port union ver.di (covering Hamburg and Bremerhaven) and rail stoppages in Rotterdam have frozen landside handovers, trapping containers at origin and extending effective transit windows to 42–50 days via the Cape.
- Carrier Capacity Discipline (Global): Ocean lines are aggressively stacking blank sailings—highlighted by 17 cancelled loops on China–Australia services—and executing port omissions (e.g., A3N skipping Shanghai all month). Carriers are using these maneuvers to recover vessel schedules ahead of Golden Week while artificially supporting rate levels.
- Transpacific Stability & Buffer Strategy (North America & General): North American import corridors remain the most stable with balanced capacity and low blank sailing activity. However, with global schedule reliability down at 56.4%, importers across all trade lanes should maintain a 7- to 14-day operational buffer beyond quoted ocean transit times to absorb port swaps and schedule revisions.
Australia
Australia

Operational performance across Australia's major container gateways is experiencing heightened landside pressure as mid-September pre-Golden Week import surges collide with off-schedule vessel arrivals from North Asian typhoon disruptions. Furthermore, the active commencement of the Department of Agriculture, Fisheries and Forestry (DAFF) 2026/27 Brown Marmorated Stink Bug (BMSB) seasonal measures on 1 September has introduced additional biosecurity hold times and processing friction across all primary import hubs.
North East Asia
North East Asia

The North East Asia–Australia trade corridor enters mid-September facing heightened operational complexity across ocean and air modes as the pre-Golden Week (1–7 October) cargo rush reaches its peak. In ocean freight, carriers are leveraging pre-holiday volume momentum and widespread port logjams following Typhoon Saudel—which left 6–10 day berthing queues across Shanghai and Ningbo—to defend recent General Rate Increases (GRIs) and enforce tactical blank sailings. Concurrently, regional air freight corridors are experiencing a sharp seasonal volume lift, with tech launches, e-commerce surges, and ocean-to-air conversions tightening freighter and belly-hold capacity out of major North East Asian gateways.
Ocean freight rates
Ocean freight rates ex-North East Asia are holding firm through mid-September as carriers successfully leverage pre-Golden Week volume surges and post-Typhoon Saudel port backlogs to defend recent rate hikes.
Rate increases enforced for early September are effectively locked in across primary trade corridors. Genuine capacity constraints—driven by 6–10 day berthing delays in Shanghai and Ningbo alongside 17 tactical blank sailings ahead of China's Golden Week (1–7 October)—have eliminated carrier discounting and sustained strong upward pricing momentum.
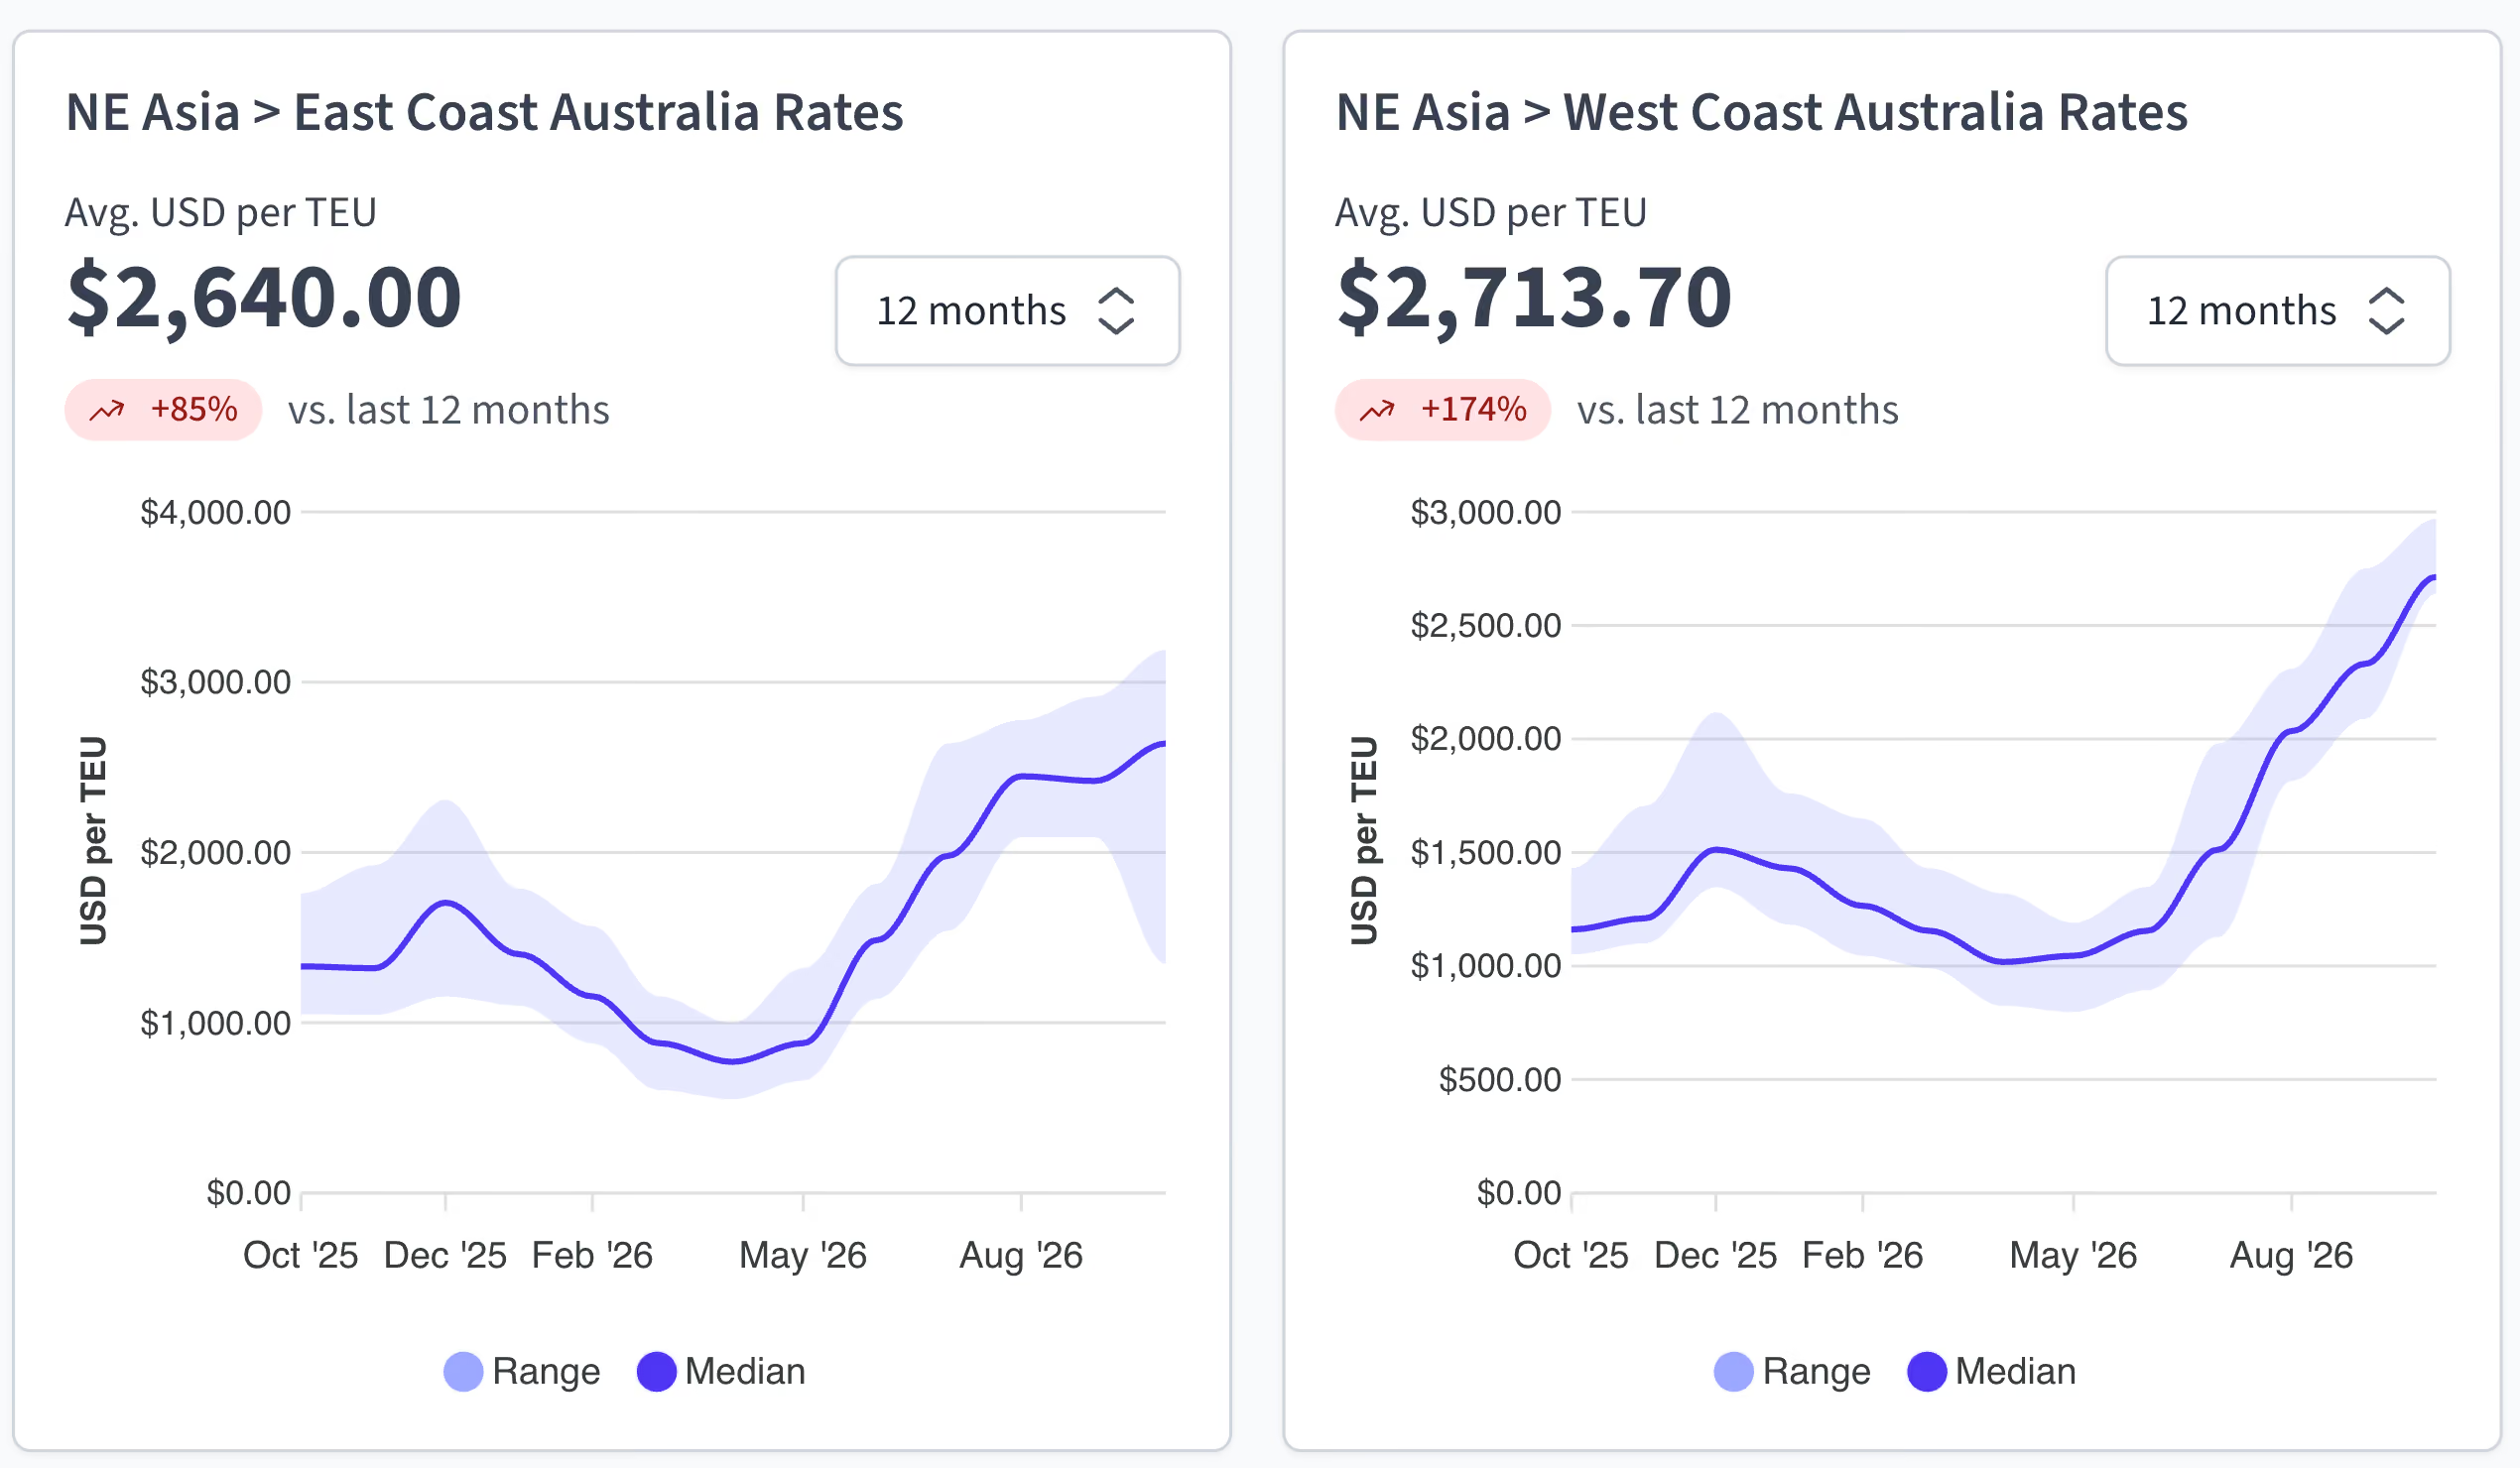
- Current rate benchmarks: Spot rates ex-China hold firm between USD 2,700 and USD 3,500 per TEU across primary Australian East Coast loops, with 1 October Rate Restoration notices already issued by major lines to defend Q4 baseline pricing.
- Contract compliance and spot prioritisation: Carriers are actively capping allocation for long-term contract (BCO) bookings and rolling non-premium cargo. Shippers on fixed contract rates face severe rolling risks unless paying spot rate differentials or premium equipment/loading guarantees to secure pre-Golden Week vessel departure.
- East vs. West Coast divergence: While East Coast direct rates have stabilised at peak levels, West Coast (Fremantle) freight faces compounding cost pressures due to elevated feeder tariffs and severe transshipment congestion upstream in Singapore and Port Klang.
- Surcharges and local tariffs: Bunker Recovery Charges (BRC/BAF) remain firm at approximately USD 450 per TEU, complemented by active Peak Season Surcharges (PSS) of USD 200–USD 400 per TEU. Furthermore, carriers are actively applying premium loading and equipment guarantees (USD 300–USD 500 per container) for shippers seeking to bypass heavy pre-holiday container rollings and secure priority vessel allocation.
- LCL consolidated freight tariffs: LCL freight ex-China and Hong Kong has tracked upward modestly to USD 35 - 50 per CBM, driven by rising origin CFS (Container Freight Station) handling charges, tight co-loading vessel allocations, and equipment processing fees ahead of the holiday shutdown.
Capacity and schedule reliability
Schedule reliability across North East Asian export hubs remains under acute strain, driven by post-typhoon berth backlogs, pre-Golden Week volume surges, and aggressive carrier schedule-reset maneuvers.
- Typhoon Saudel berth backlogs: Terminal suspensions across Shanghai (Yangshan) and Ningbo-Zhoushan—which halted operations for up to 54 and 78 hours respectively—have left berthing queues of 6–10 days, creating severe vessel bunching across East China anchorages.
- Tactical port omissions: Carriers are executing widespread port omissions to bypass congested hubs and recover schedule integrity, highlighted by the A3N service skipping Shanghai calls for all of September, which is forcing rolled cargo onto downstream rotations.
- Yard density & container rollover rates: Post-typhoon yard density at Shanghai and Ningbo (exceeding 80–85% capacity utilisation) is driving container rollover rates of 20–30% for standard bookings, with non-premium cargo routinely bumped to subsequent weekly departures.
- Pre-Golden Week capacity discipline: Ocean lines have scheduled 17 blank sailings on China–Australia loops ahead of the 1–7 October holiday shutdown, artificially constraining slot supply to maintain vessel utilisation near capacity.
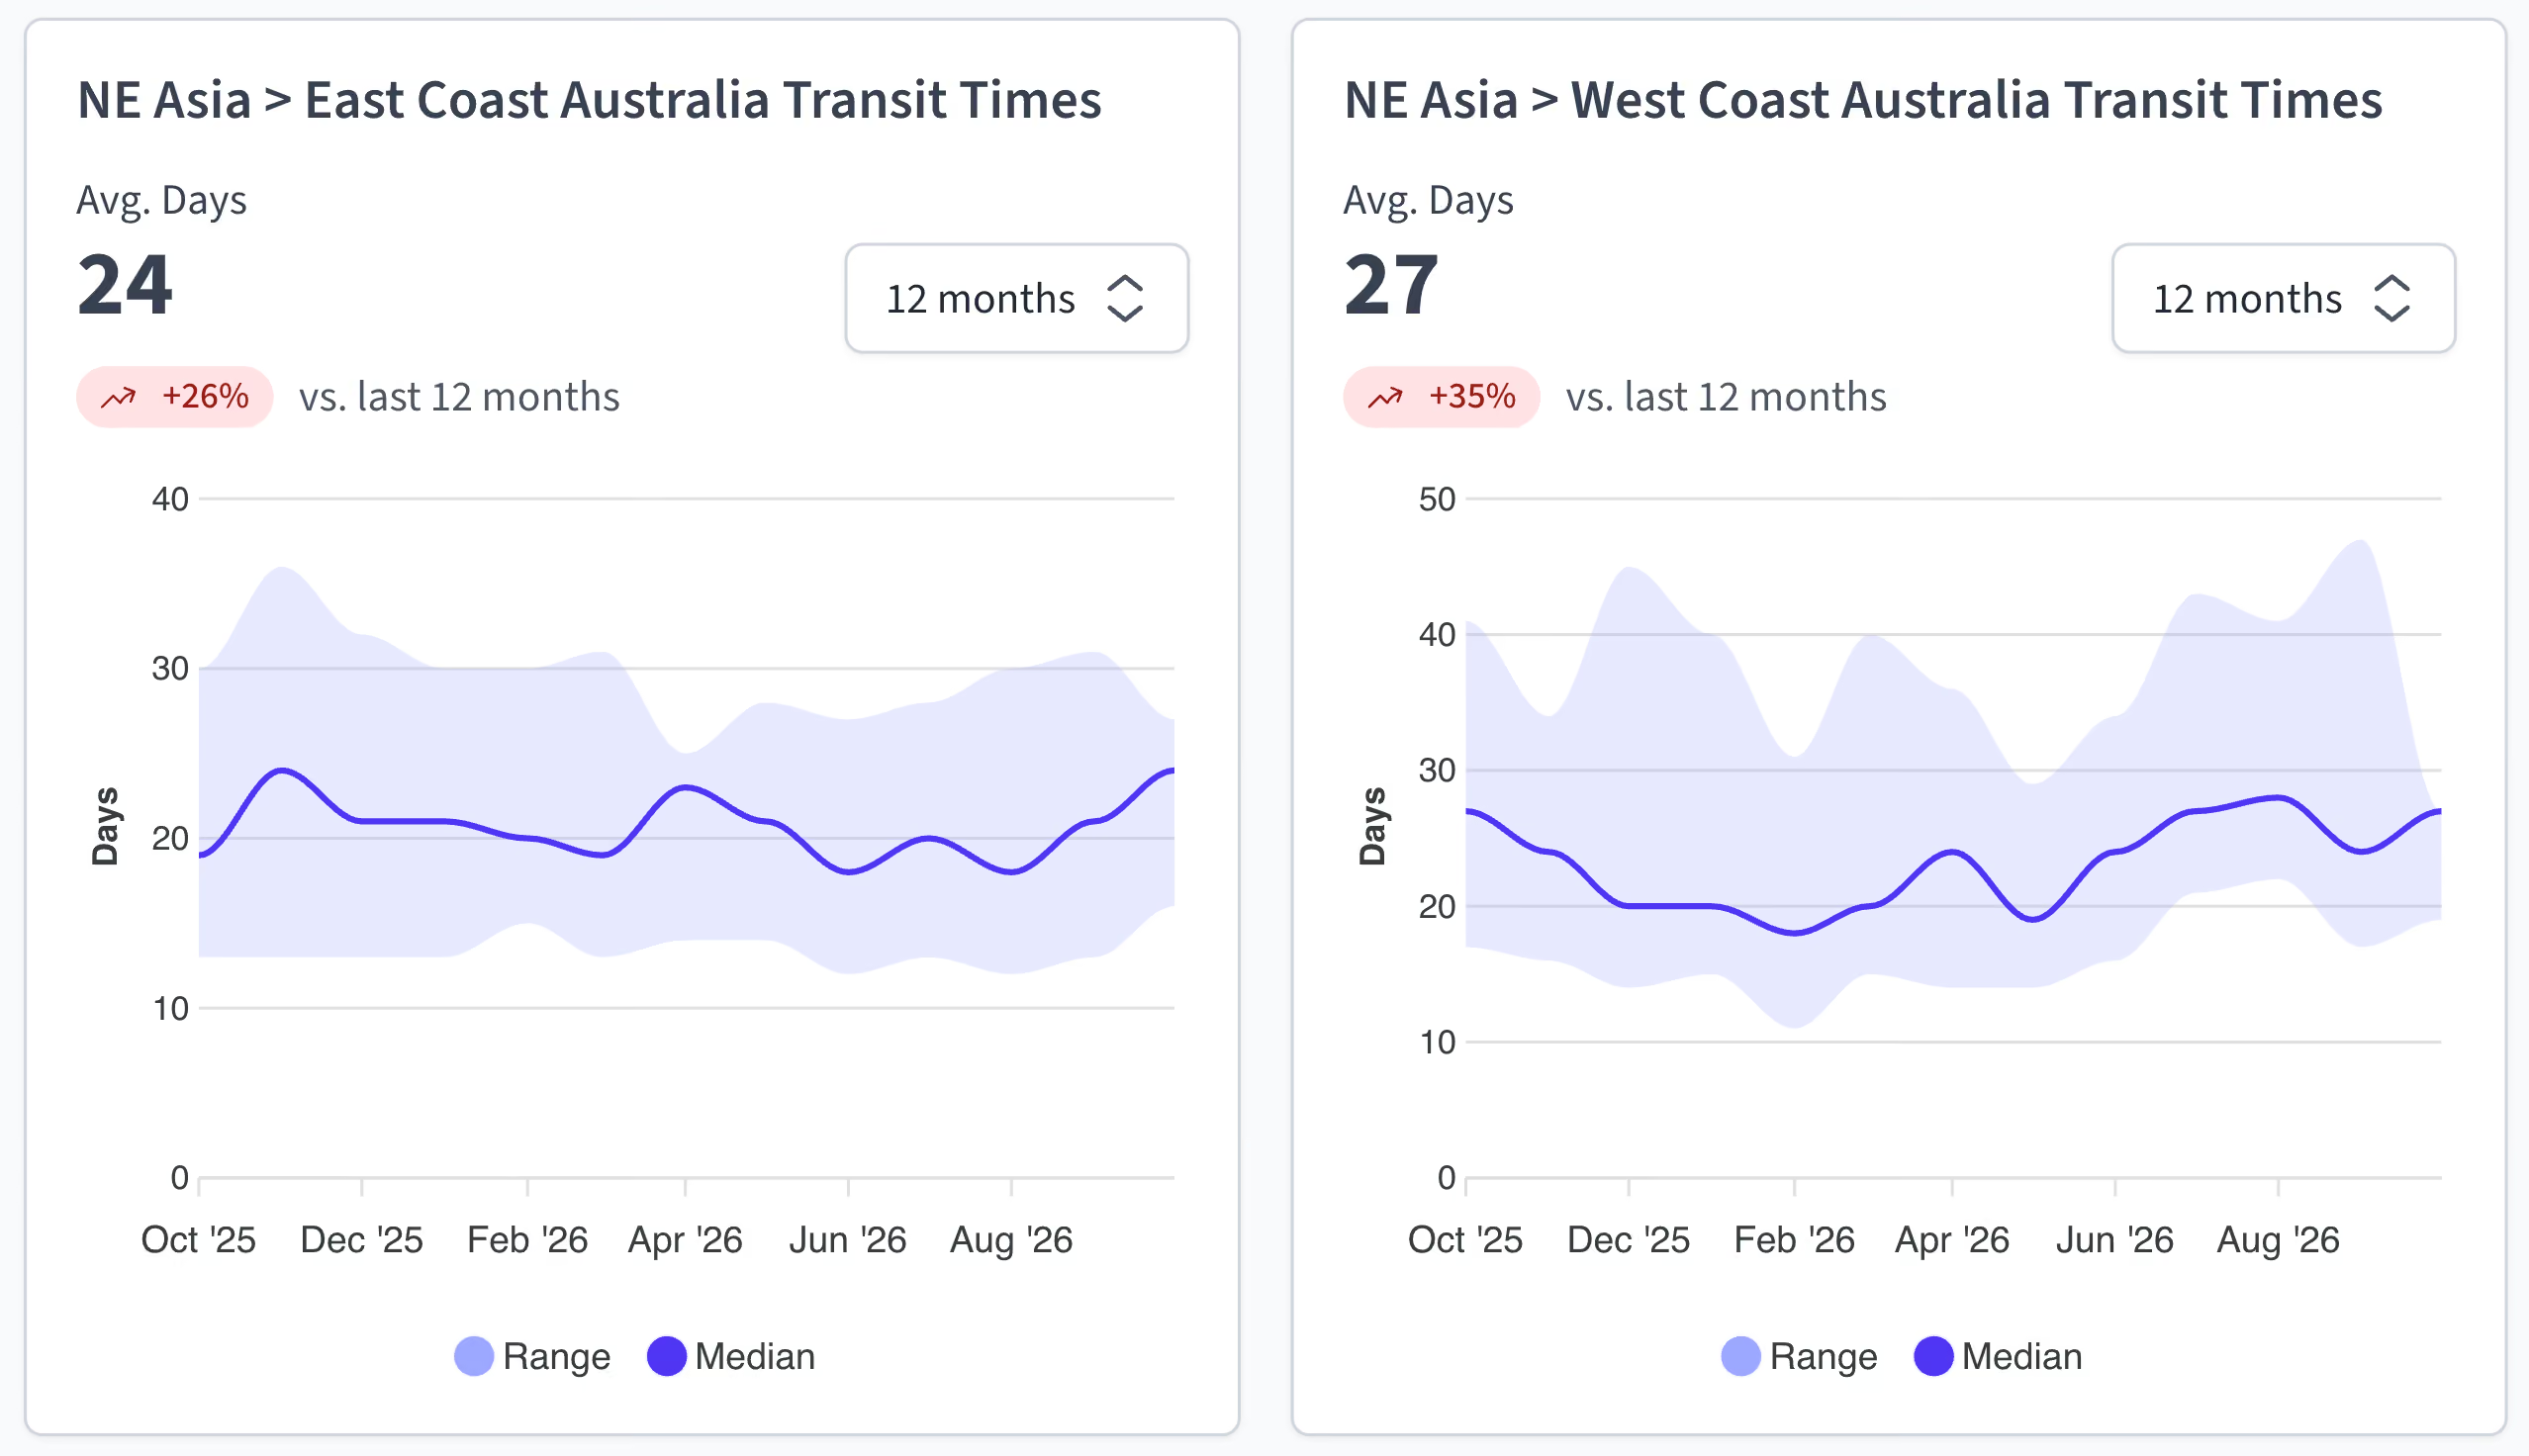
- Transit time extensions: Standard pro-forma port-to-port transit times from main hubs (Shanghai, Ningbo, Shenzhen) to East Coast Australia sit at 14–24 days. However, origin berth delays, anchorage waits, and port swaps are extending effective ocean lead times to 20–32 days.
- Intermodal and feeder network friction: Feeder barge operations along the Yangtze River Delta and Pearl River Delta face 3–5 day connection delays, restricting export container staging into primary gateway terminals.
- Container equipment imbalances: Supply of standard 20ft and 40ft dry containers at main Chinese hubs remains adequate, but 40HC equipment tightness persists at secondary regional feeder ports due to heavy Transpacific repositioning.
Air freight
Air freight markets across North East Asia are experiencing a seasonal volume surge, driven by pre-Golden Week inventory rushes, major consumer technology launches, and urgent ocean-to-air cargo conversions resulting from sea port delays.
- Typhoon Saudel flight disruptions and backlogs: Recent severe weather across East China led to over 400 cancelled freighter and passenger flights across Shanghai Pudong (PVG), Hangzhou (HGH), and Ningbo, generating temporary tarmac congestion and 2–3 day ground handling delays that are actively clearing.
- Sectoral demand drivers: Outbound volumes ex-China, Hong Kong, South Korea, and Taiwan remain exceptionally strong, fuelled by direct-to-consumer e-commerce surges, semiconductor hardware shipments, and shippers converting delay-sensitive sea freight to air ahead of the 1–7 October Golden Week shutdown.
- Freighter and bellyhold capacity constraints: Although passenger bellyhold capacity remains stable, heavy Block Space Agreements (BSAs) locked by e-commerce giants continue to restrict spot freighter space, requiring 7–10 days advance booking lead times for heavy cargo (+1,000 kg).
- Origin ground dwell times: Heightened pre-holiday customs screening alongside high export warehouse utilisation at Hong Kong (HKG) and PVG are adding 24–48 hours of origin dwell time prior to flight departure.
South East Asia
South East Asia

The South East Asia–Australia trade corridor enters mid-September navigating critical transshipment bottlenecks and heightened operational strain across major hub ports. Severe congestion in Singapore and Port Klang—driven by vessel re-routings, off-schedule arrivals, and heavy transshipment volumes—is cascading into secondary regional hubs. As carriers strive to maintain schedule integrity, feeder connection delays and space constraints are keeping spot freight rates elevated and extending total end-to-end transit times.
Ocean freight rates
Ocean freight rates ex-South East Asia are holding firm as carriers leverage severe transshipment port congestion and high vessel utilisation to defend rate floors across Australian trade lanes.
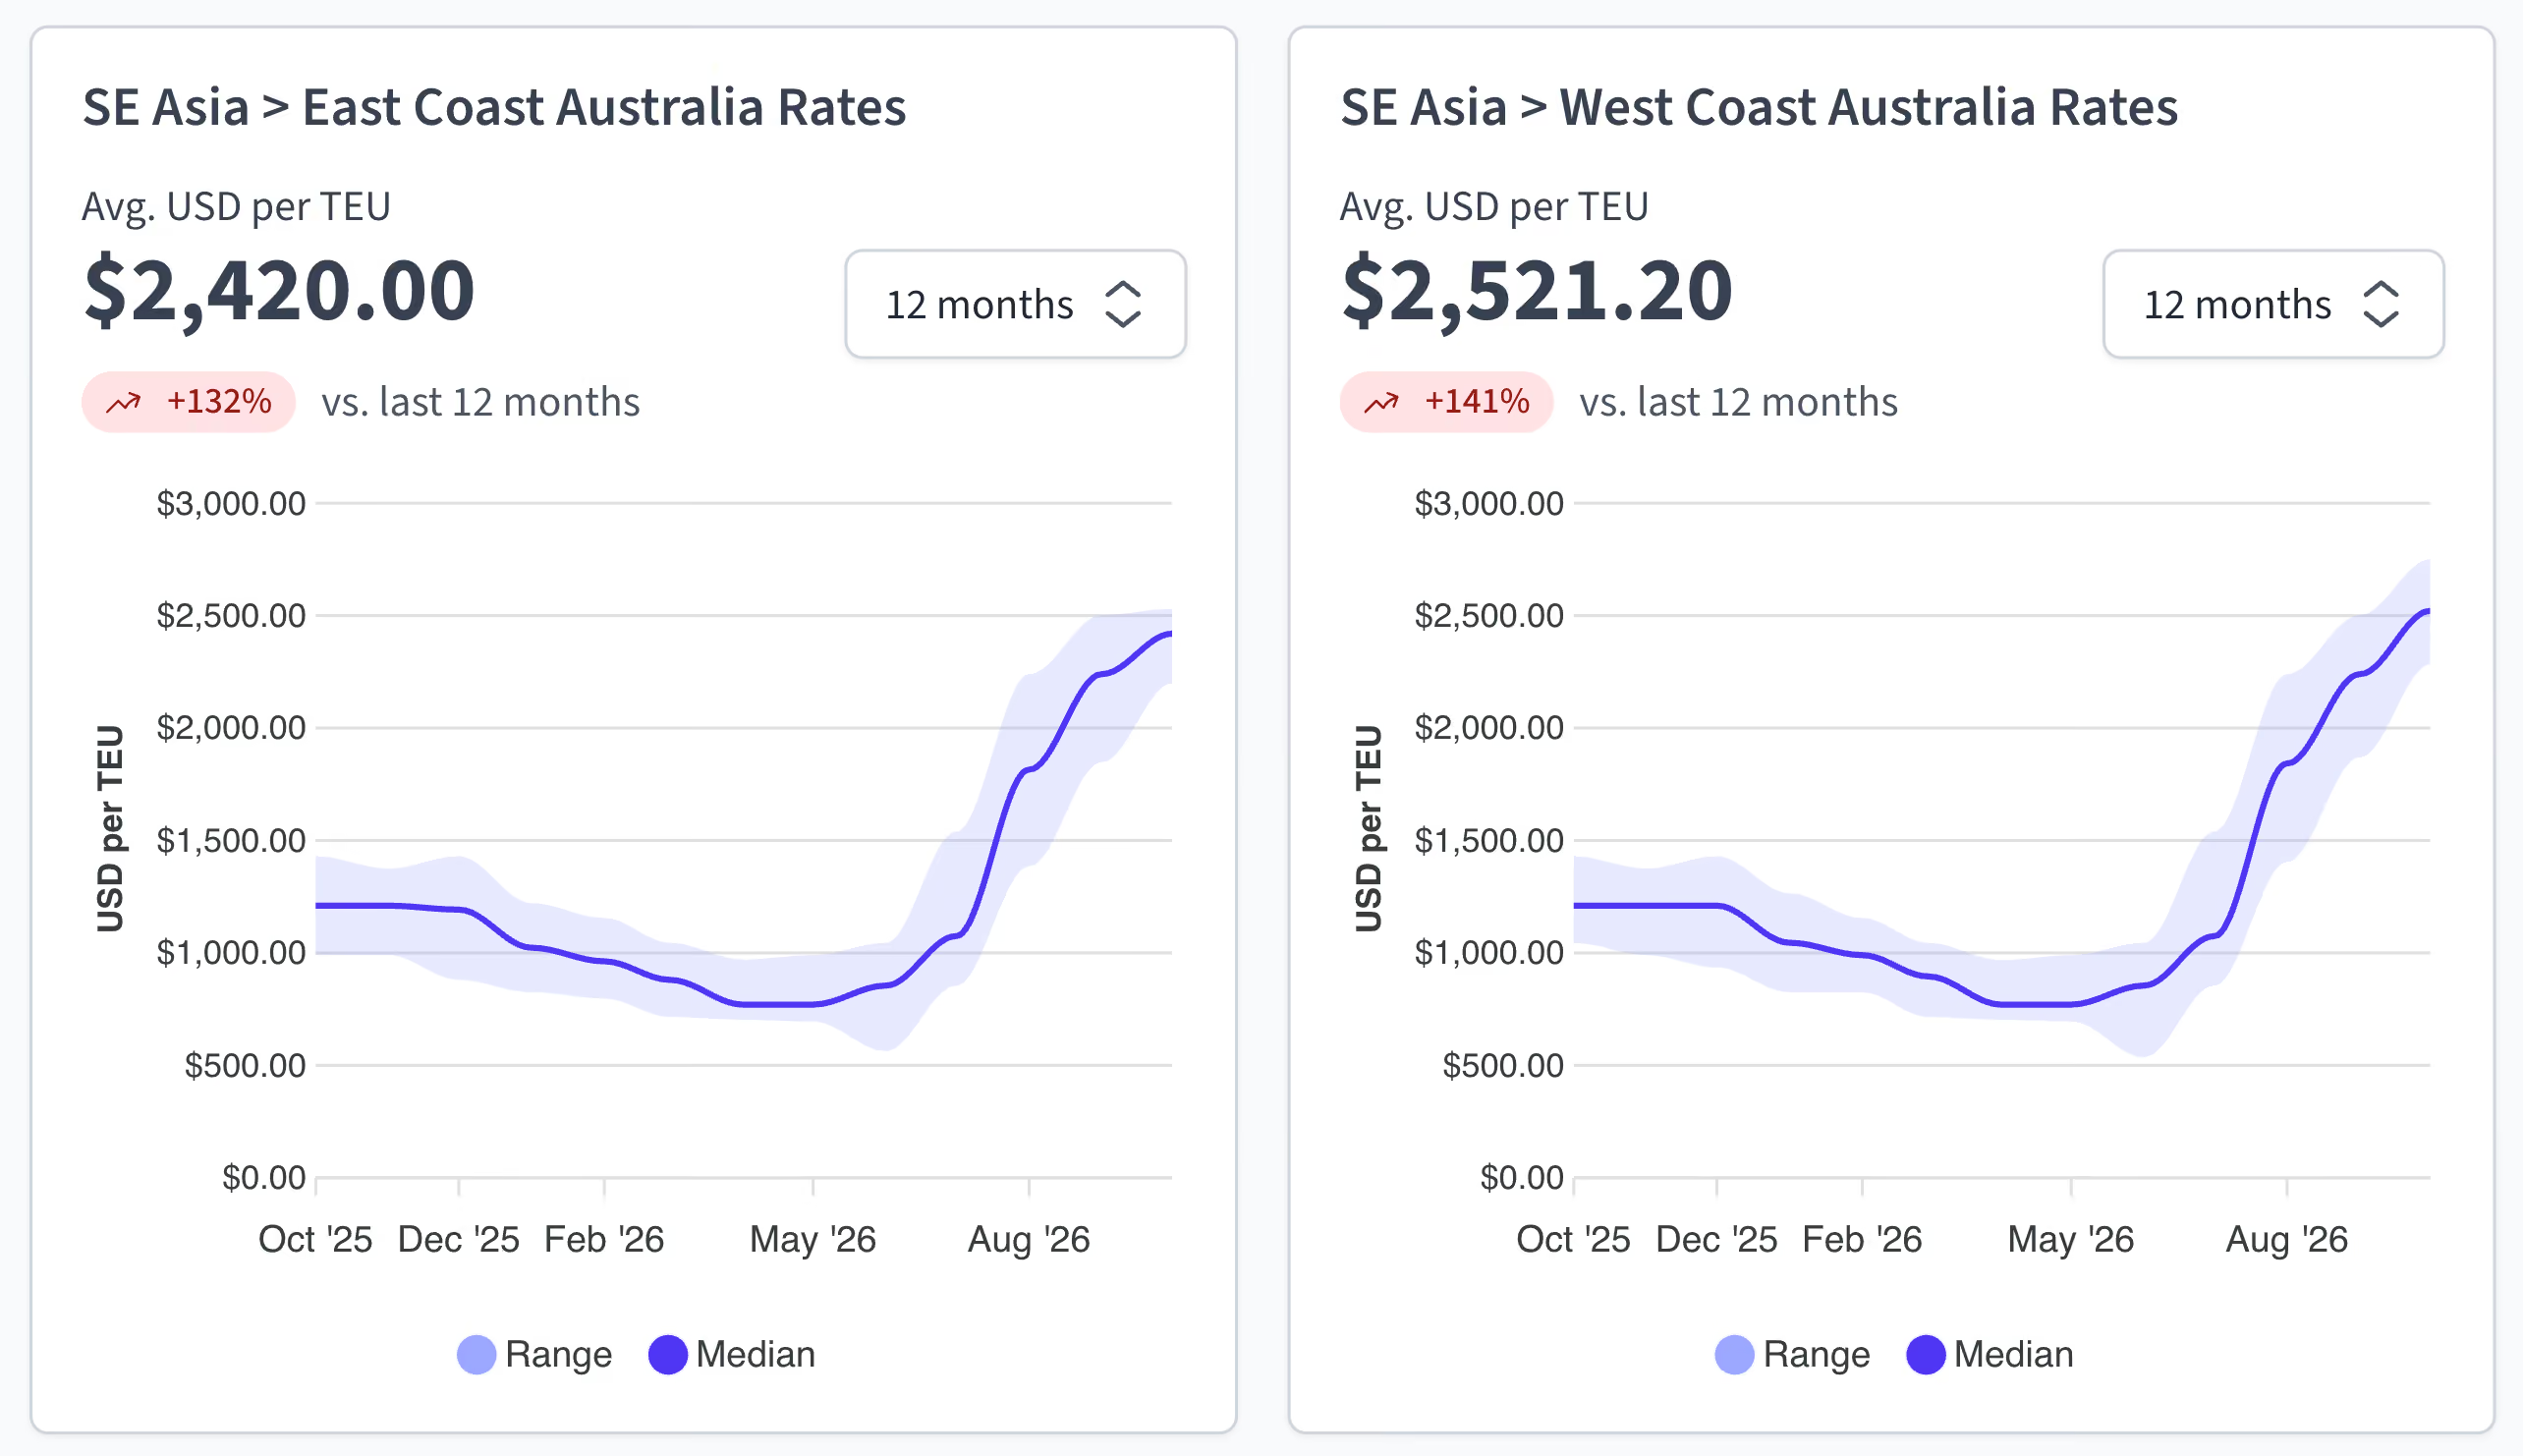
- Current rate benchmarks: Spot rates ex-South East Asia (Singapore, Malaysia, Vietnam, Thailand) hold firm between USD 2,350 and USD 2,650 per TEU to primary Australian East Coast ports.
- Transshipment premium for West Coast: Direct and transshipped services to Fremantle (PER) command elevated rates due to severe feeder bottlenecks in Singapore and Port Klang, carrying a USD 200–USD 400 per TEU premium over baseline East Coast rates.
- Contract compliance and allocation caps: Mainline carriers are strictly enforcing space caps on long-term BCO contract tiers, pushing overflow cargo onto higher-yielding spot rates or requiring Emergency Transshipment Surcharges (ETS).
- Surcharges and local tariffs: Peak Season Surcharges (PSS) of USD 150–USD 300 per TEU remain active across major South East Asian loading hubs, alongside Bunker Recovery Charges (BRC/BAF) holding firm near USD 420 per TEU.
- LCL consolidated freight tariffs: LCL freight ex-Singapore, Port Klang, and Ho Chi Minh City remains firm at USD 30–USD 45 per CBM, with revised CFS origin handling charges taking effect from 1 September.
- Cape of Good Hope rerouting pressures: Ongoing global network detours around the Cape of Good Hope continue to cluster vessel arrival windows into primary ASEAN transshipment hubs, compounding pre-Golden Week volume spikes and limiting spare yard capacity.
Capacity and schedule reliability
Schedule reliability across South East Asian hubs remains heavily compromised with mainline vessel delays and severe transshipment yard density creating compounding knock-on effects across regional feeder networks.
- Major hub congestion (Singapore & Port Klang): Berthing delays at Singapore and Port Klang hold at 3–5 days, with yard utilisation exceeding 85%, causing frequent missed feeder connections and container dwell time spikes.
- Feeder connection disruptions: Transshipment cargo bound for Australia faces 7–12 days of transshipment dwell time in Singapore and Port Klang, severely impacting reliability for non-direct services.
- Blank sailings and port skips: Carriers are executing selective blank sailings and skipping secondary feeder calls across Vietnam (Tan Cang Cat Lai) and Thailand (Laem Chabang) to recover mainline schedule integrity.
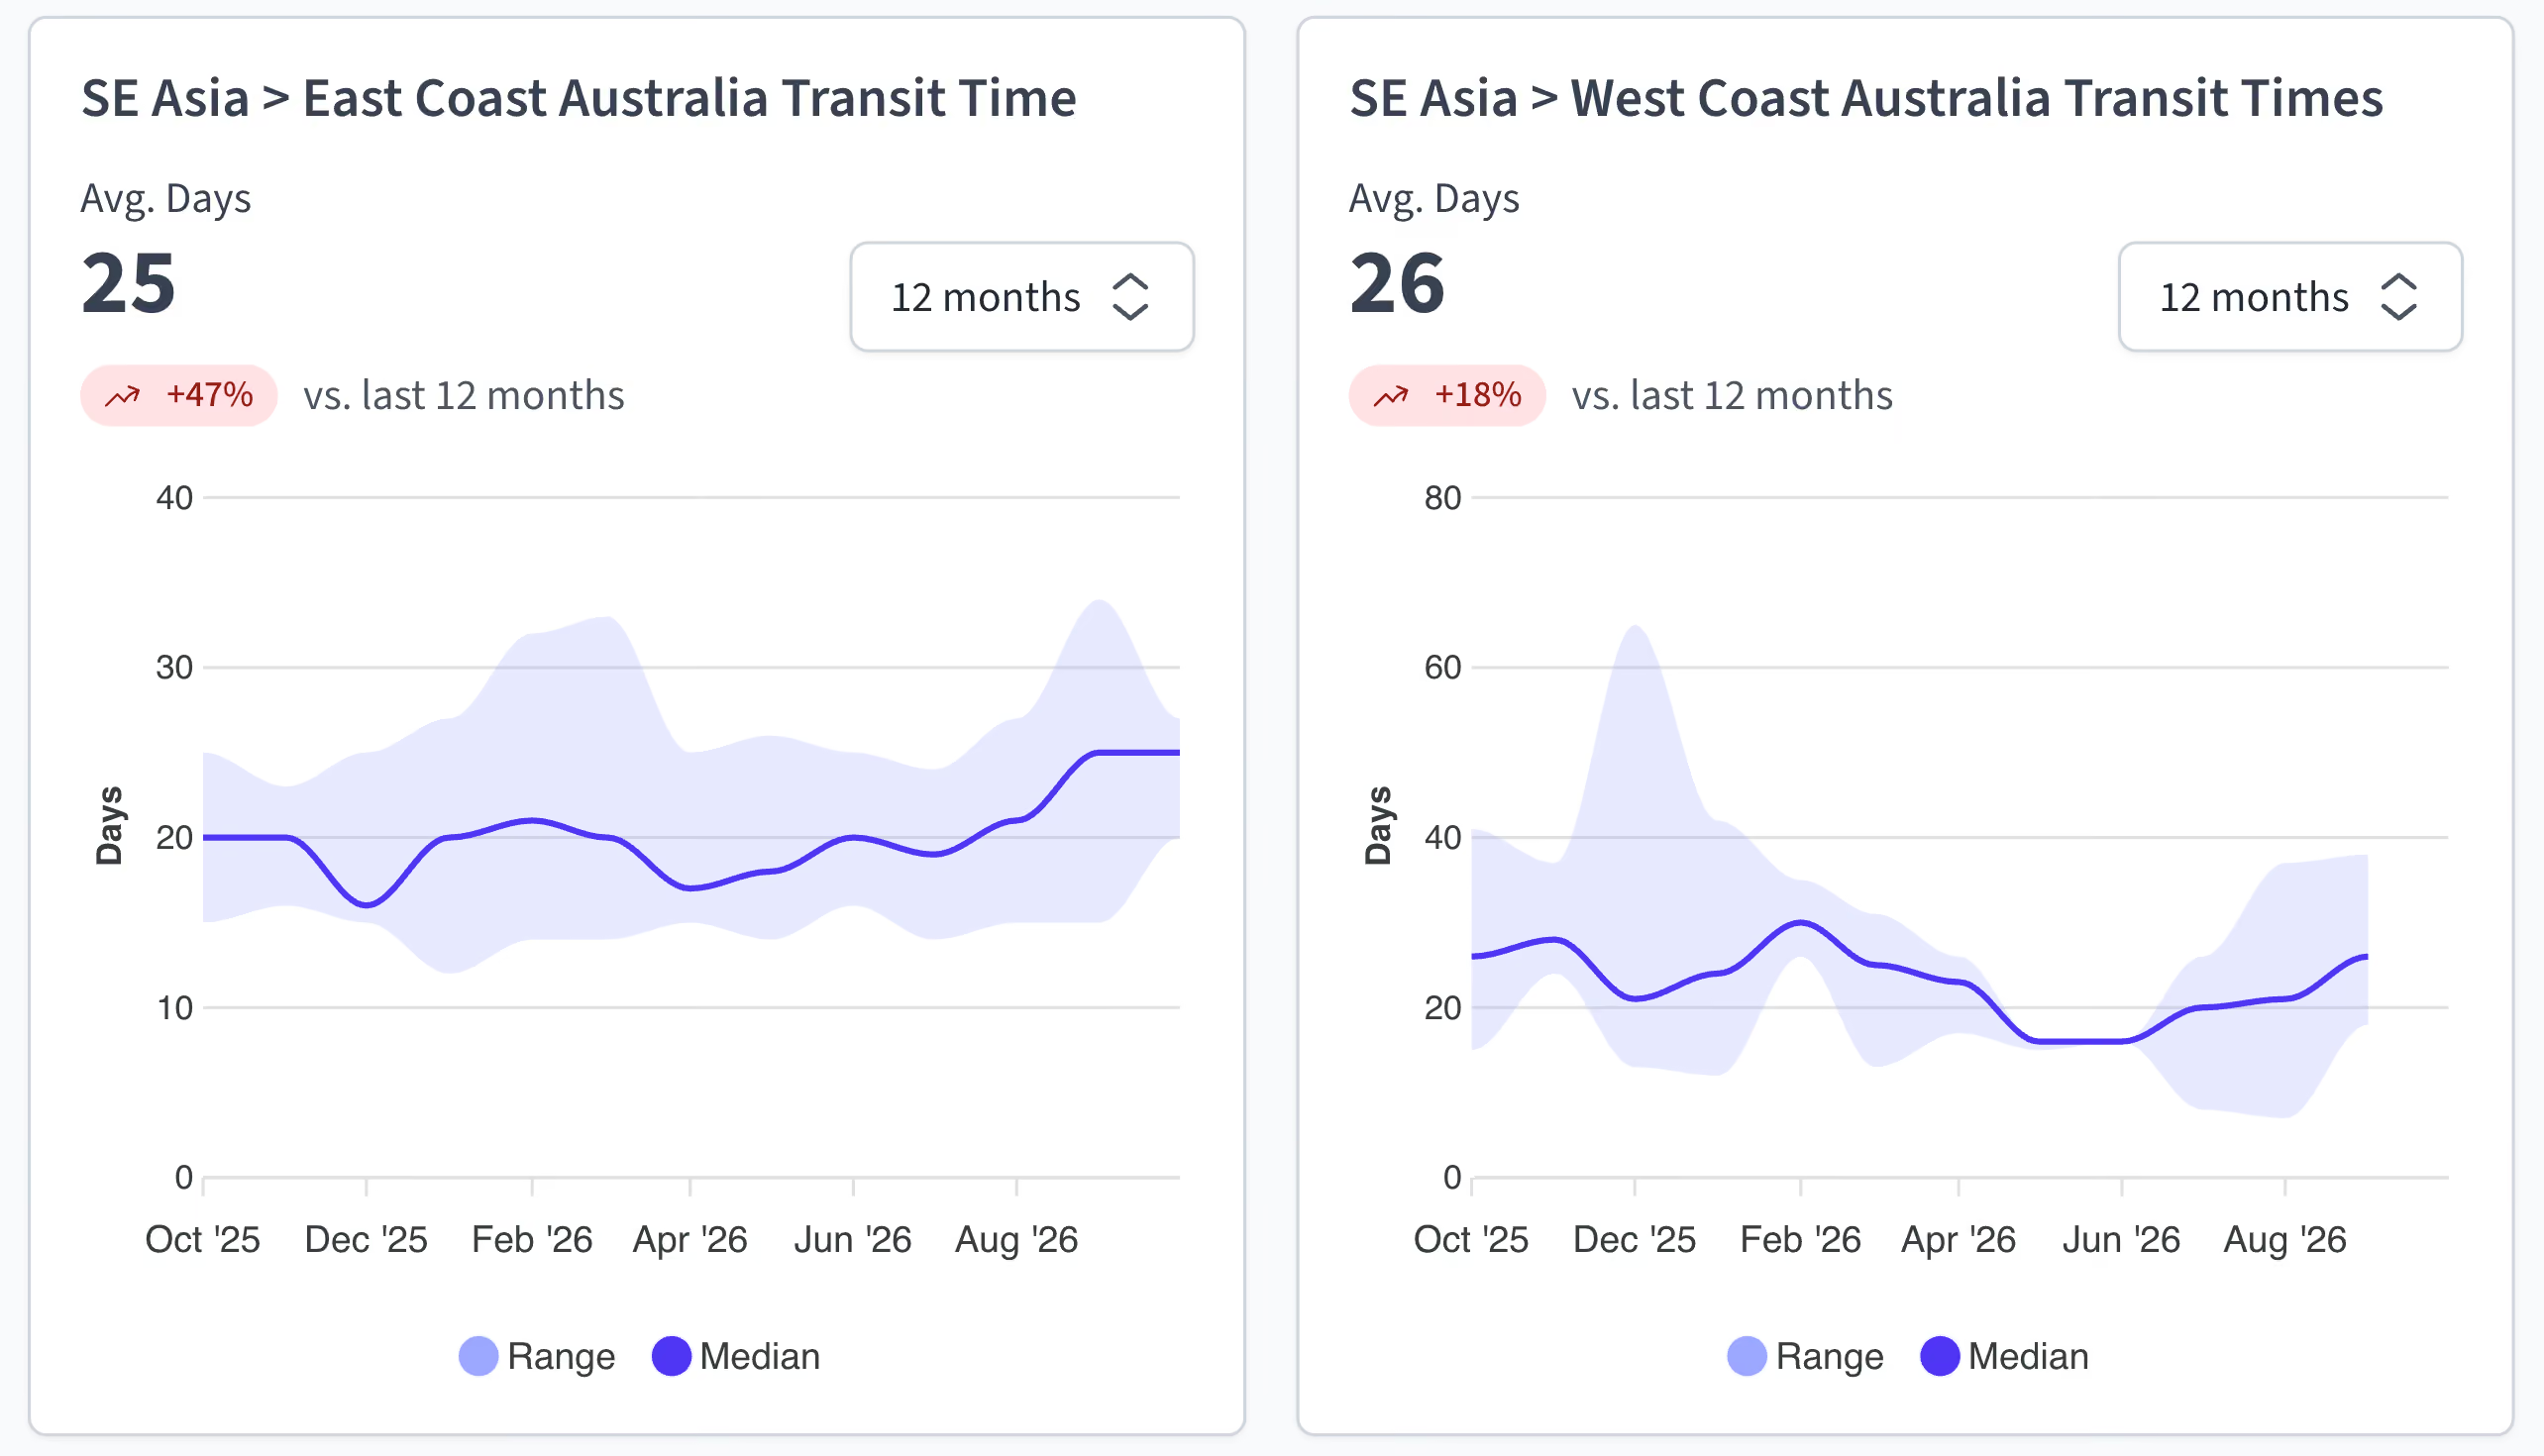
- Transit time extensions: Pro-forma transit times from main South East Asian hubs to East Coast Australia average 12–18 days, but transshipment delays and berth waits are pushing effective ocean lead times to 22–30 days.
- Offshore biosecurity compliance (DAFF BMSB): Offshore treatment facilities in Singapore, Malaysia, and Vietnam are managing seasonal volume increases under the 1 September DAFF BMSB regulations, adding 2–3 days of origin processing time.
- Container equipment availability: Standard dry equipment remains available across major gateways like Singapore and Port Klang, though 20ft and 40HC equipment shortages persist in outports like Jakarta and Bangkok.
Air freight
Air freight markets across South East Asia remain firm into mid-September with tightening capacity, rising rates, and active carrier yield management compressing available uplift into Australian gateways.
- Demand drivers: Outbound air cargo volumes from Vietnam, Thailand, Malaysia, and Singapore remain strong, supported by consumer electronics, automotive components, and urgent conversions from delayed sea freight transshipments.
- Perishable vs. E-commerce space competition: Seasonal agricultural exports out of Thailand and Vietnam (including perishable fruit peaks) are competing directly with transshipment e-commerce volumes for freighter space, forcing general cargo onto higher-tier express air rates.
- Capacity and booking lead times: Passenger bellyhold capacity across major regional airlines remains well-utilised, while freighter space out of Hanoi (HAN), Ho Chi Minh City (SGN), and Bangkok (BKK) requires 5–7 days advance booking lead times.
- Transit and ground handling dynamics: Transit times remain fluid across major hub airports (SIN, KUL, BKK), though high export volume surges at SGN and HAN are generating 24–36 hours of origin ground dwell time prior to departure.
India Subcontinent
India Subcontinent

The Indian Subcontinent (ISC)–Australia logistics corridor enters mid-September navigating heightened operational complexity, driven by post-monsoon landside bottlenecks, inland container depot (ICD) rail rake shortages, and strict offshore biosecurity compliance under Australia's 2026/27 BMSB seasonal measures (effective 1 September). At Nhava Sheva (JNPA) and Mundra, terminal yard density sits above 85% as transport operators clear backlogs from late South-West monsoon rain suspensions and private yard Lift-On/Lift-Off (LOLO) charge disputes. These landside delays, combined with delayed empty container repositioning from North Indian ICD hubs (Delhi/NCR and Ludhiana), continue to restrict export container availability across Western Indian gateways.
Regional transshipment networks remain under severe strain. Colombo Port—a vital relay hub for South India and Bangladesh cargo—faces heavy yard congestion and inter-terminal transfer delays resulting from ongoing Middle Eastern maritime realignments and vessel reroutings. Transshipment dwell times at Colombo hold between 7 and 14 days, compounded by secondary feeder logjams in Singapore and Port Klang. In Bangladesh, Chittagong port operations contend with 5-to-8-day berth queues and inland transport friction, delaying apparel shipments bound for peak Q4 retail markets. Ocean spot rates ex-India to Australia remain firm on an upward trajectory (USD 2,400–USD 2,750 per TEU), supported by carrier 1 September Rate Restorations and strict space allocation caps. Consequently, cargo rolling risks remain high, pushing effective door-to-door ocean lead times to an unreliable 30 to 40 days (against historical 18–25 day pro-forma transits). Importers utilising AI-ECTA preferential tariffs should ensure origin Certificate of Origin compliance early to avoid secondary customs staging holds upon arrival in Australia.
Air freight
Air freight markets across the Indian Subcontinent remain tight, with elevated rates, constrained capacity, and active carrier yield management compressing uplift availability into Australian gateways.
- Space constraints and destination pressure: Capacity remains compressed across primary export hubs (Delhi, Mumbai, Dhaka, and Colombo), with cargo destined for Sydney, Melbourne, and Brisbane facing acute space pressure, strict weight restrictions, and 5-to-8-day advance booking requirements for shipments exceeding 1,000 kg.
- Transshipment and operational disruptions: Flight reroutings and connection delays through key Middle Eastern hubs (Dubai, Doha) and secondary Asian gateways continue to compromise schedule integrity, generating 24–48 hours of transit dwell time during peak weekend departures.
- Baseline capacity and contingency solutions: Core passenger bellyhold space on major trunk routes into Australia provides baseline stability, complemented by forwarder Blocked Space Agreements (BSAs) and multi-stop economy routing options to mitigate spot market volatility for non-urgent freight.
North America
North America

Market conditions ex-North America into Australia remain balanced through mid-September, though operational pressure and schedule disruptions persist across ocean and inland intermodal networks. Export volumes across major North American gateways reflect heavy front-loaded inventory movements as shippers hedge against late-Q3 Transpacific congestion and trade policy shifts. Importers accelerating peak shipping windows have driven high container volume spikes through US West Coast (USWC) and Canadian gateways, compressing transload staging windows at Los Angeles/Long Beach and Seattle-Tacoma while generating 2–4 day gate delays for outbound Oceania cargo.
For ocean cargo moving ex-North America into Oceania, key operational dynamics include:
- Direct West Coast Loops: Direct services ex-USWC (Los Angeles, Long Beach, Oakland, Vancouver) to Australian East Coast ports hold steady at 26–32 days transit. However, vessel schedule reliability has dropped by 6 to 9 days due to US West Coast anchorage bunching and delayed vessel turnarounds from Asia.
- US East & Gulf Coast loops: Direct and transshipped services ex-US East Coast (Savannah, Charleston, New York) and Gulf ports command USD 3,400–USD 4,400 per TEU, reflecting elevated Panama Canal transit surcharges and longer transit rotations.
- Panama Canal draft restrictions (US East Coast loops): The Panama Canal Authority (ACP) tightened Neopanamax lock draft limits down to 48.5 feet (14.78 metres) into August and September 2026 following below-average watershed rainfall. Ocean carriers on US East/Gulf Coast-to-Australia rotations are trimming max container payloads and applying variable Fresh Water Surcharges, placing upward pressure on East Coast baseline freight rates.
- Transshipment via Asia: Secondary transshipment options routed via Asian hubs (Busan, Shanghai, Singapore) stretch total ocean lead times to 40–52 days, leaving shipments highly vulnerable to regional feeder logjams and post-typhoon port backlogs.
- Canadian & US Intermodal Rail: Canadian export flows via Vancouver and Prince Rupert face persistent rail dwell friction (4–8 days) across CN and CPKC intermodal yards in Toronto and Montreal. Similarly, US Midwest ICD hubs (Chicago, Memphis, Dallas) face chassis shortages and seasonal grain priority movements, adding USD 600–USD 1,200 per container in inland intermodal surcharges.
- FMC detention and free-time enforcement: Stricter Federal Maritime Commission (FMC) billing rules across US ports have led ocean lines to aggressively restrict container free-time at inland rail ramps (Chicago, Dallas, Memphis). Shippers face immediate demurrage penalties if inland drayage or offshore biosecurity treatment (DAFF BMSB) exceeds strict origin terminal dwell windows.
- Biosecurity Compliance Notice: With Australia's 2026–2027 Brown Marmorated Stink Bug (BMSB) season fully active since 1 September, target high-risk goods (machinery, vehicles, steel, tools) originating from both the USA and Canada face mandatory offshore treatment (heat treatment, methyl bromide, or approved alternative chemicals) and strict adherence to the 120-hour post-treatment container sealing rule. Breakbulk, open-top, and flat-rack shipments departing target North American ports without approved offshore treatment face mandatory re-export or re-direction upon arrival in Australia.
Air freight
Air freight conditions ex-North America into Australia remain compressed, driven by elevated jet fuel surcharges, high export warehouse utilisation, and airline payload restrictions that continue to limit spot uplift into Australian gateways.
- Gateway capacity and destination pressure: Outbound capacity across major gateways (Los Angeles, New York, Chicago, Vancouver, and Toronto) remains tight due to prioritised tech-sector and aerospace volume allocations, with Sydney and Melbourne facing the heaviest spot space restrictions and strict weight caps.
- Transshipment and network disruptions: Long-haul flight payload adjustments and second-leg connection delays through Asian and Middle Eastern transshipment hubs continue to generate 24–48 hours of transit dwell time for multi-stop air cargo bound for Australia.
- Belly-hold baseline and BSA options: Core passenger bellyhold capacity on direct Transpacific routes provides stable baseline uplift, supplemented by forwarder Blocked Space Agreements (BSAs) and dedicated ULD allocations out of West Coast hubs (LAX, SFO) to secure space for shipments exceeding 1,000 kg.
Europe
Europe

The Europe–Australia trade corridor enters mid-September navigating compound lead-time volatility, driven by ongoing Red Sea maritime diversions around the Cape of Good Hope and the implementation of Australia's 2026/27 DAFF BMSB seasonal measures (effective 1 September). Major European loading hubs across North Europe and the Mediterranean are managing extended transit loops and secondary feeder delays into Asian transshipment gateways. Concurrently, strict biosecurity mandates across key target-risk countries (including Germany, Italy, France, and Spain) are compressing origin terminal dwell windows and requiring mandatory offshore treatment for high-risk breakbulk and containerised cargo.
Ocean freight rates
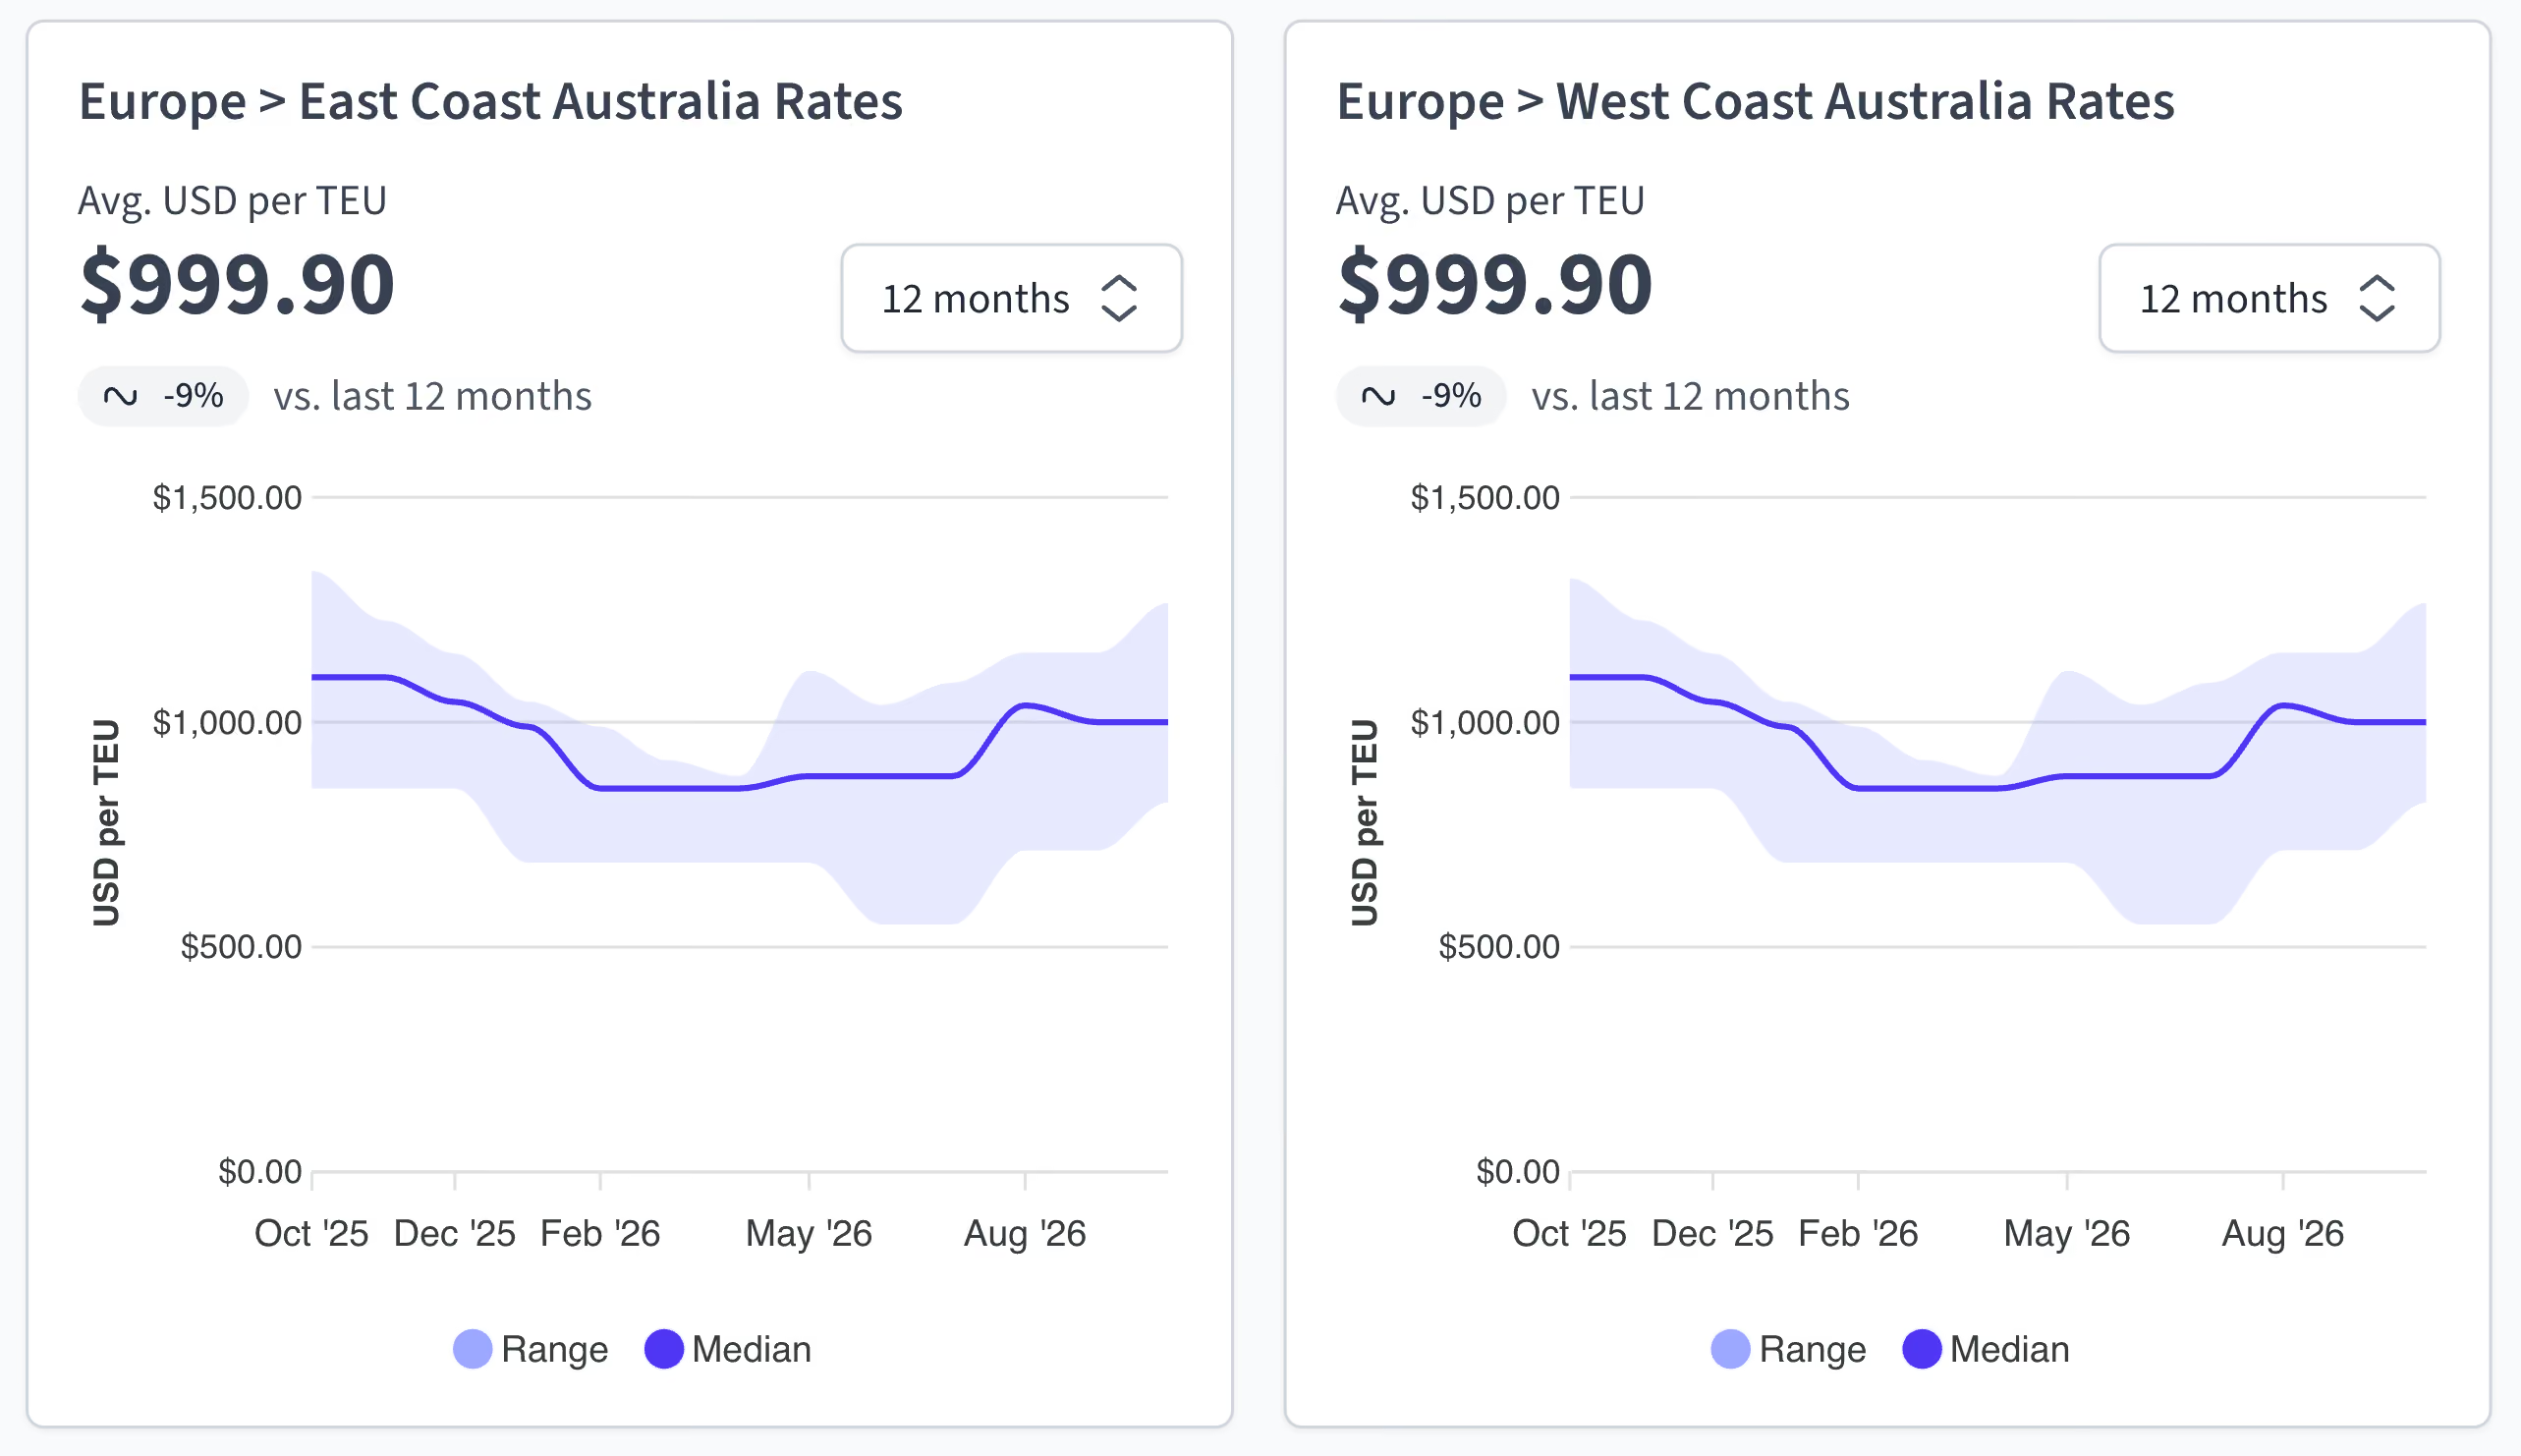
Ocean freight rates ex-Europe to Australia remain elevated as carriers offset longer Cape rerouting distances, EU ETS carbon compliance tariffs, and firm bunker fuel surcharges.
- Current rate benchmarks (North Europe to Australia): Spot rates ex-Main North Europe ports (Rotterdam, Hamburg, Antwerp, Southampton) sit between USD 2,200 and USD 3,100 per TEU (USD 4,200–USD 5,800 per FEU) to primary Australian East Coast ports.
- Mediterranean port benchmarks: Direct and feeder loadings ex-Mediterranean ports (Genoa, Barcelona, Valencia, La Spezia) command elevated rates of USD 2,400–USD 3,400 per TEU, reflecting feeder relay costs and Mediterranean port congestion.
- EU ETS & environmental surcharges: European Union Emissions Trading System (EU ETS) surcharges add USD 35–USD 65 per TEU across Europe-originating loops, alongside firm Bunker Recovery Charges (BRC/BAF) driven by extended Cape of Good Hope transit distances.
- EU ETS 70% phase-in & regulatory cost escalation: The European Union Emissions Trading System (EU ETS) maritime phase-in has reached 70% of reported emissions (up from 40%), alongside the inclusion of methane (CH4) and nitrous oxide (N2O) under full (CO2e) accounting. Combined with initial FuelEU Maritime targets, ocean carriers are expanding dedicated environmental surcharges (EUR 35–EUR 65 per TEU) to offset compliance costs across all Europe-to-Oceania loops.
- Contract compliance & allocation caps: Mainline carriers are strictly enforcing Minimum Quantity Commitments (MQCs) on long-term BCO contract tiers, pushing unallocated volume onto spot rates or charging premium equipment/loading guarantees (USD 300–USD 500 per container).
- LCL consolidated freight tariffs: LCL rates ex-North Europe and Mediterranean gateways hold steady at USD 45–USD 65 per CBM, with origin CFS handling fees adjusting upward for biosecurity-compliant processing.
Capacity and schedule reliability
Schedule reliability on Europe–Australia loops remains severely compromised with Cape reroutings and transshipment bottlenecks stretching end-to-end lead times.
- Cape of Good Hope transit extensions: The continuation of vessel detours around Southern Africa adds 3,500 nautical miles and 10–14 additional sailing days, bypassing the Suez Canal and extending total ocean transit times ex-North Europe to East Coast Australia to 48–62 days.
- Transshipment hub delays: Cargo transshipped via Singapore, Port Klang, or Colombo experiences compounding delays, adding 7–14 days of transshipment dwell time before final relay into Australia.
- Biosecurity compliance (DAFF BMSB): Under the 2026/27 DAFF seasonal rules effective 1 September, offshore treatment facilities (heat treatment and methyl bromide) across target European risk nations face heavy seasonal processing volumes, adding 3–6 days of origin dwell time.
- European port yard density: North European gateways (Rotterdam, Hamburg, Antwerp) report container yard density above 80%, driven by off-schedule vessel arrivals and uncoordinated export container staging.
- Rhine River low water levels & inland barge constraints: Late-summer drought across Central Europe has pushed water levels at the Kaub choke point to low levels. Barges along the Rhine River corridor—linking industrial manufacturing zones in Germany, Switzerland, and France with Rotterdam and Antwerp—are forced to navigate at 25–40% capacity. This has triggered steep Low Water Surcharges (KWZ) and pushed container overflow onto Central European rail and road corridors, which face secondary congestion.
- Container equipment imbalances: Standard dry container availability at main maritime ports remains adequate, but 40HC and specialised equipment (Open Top, Flat Rack) shortages persist across inland ICDs in Central Europe (Germany, Austria, Czechia).
Air freight
Air freight markets ex-Europe to Australia remain tight supported by high-value pharmaceutical exports, luxury retail goods, automotive machinery, and ocean-to-air conversions.
- Sectoral demand drivers: Outbound volumes ex-Germany (FRA), UK (LHR), Netherlands (AMS), and France (CDG) remain firm, driven by seasonal automotive component restocking, life sciences logistics, and urgent conversions from extended sea freight routes.
- Capacity and booking lead times: Dedicated passenger bellyhold capacity on Middle Eastern carriers (Emirates, Qatar Airways, Etihad) provides consistent baseline uplift, though freighter space out of Frankfurt (FRA) and Amsterdam (AMS) requires 5–8 days advance booking lead times for heavy cargo (+1,000 kg).
- Spot rate benchmarks (ex-Europe to Australia): General cargo spot rates ex-North Europe and UK hold firm at EUR 3.80–EUR 5.20 per kg (approx. USD 4.10–USD 5.60 per kg) for +500 kg / +1,000 kg tiers, with express/priority freight commanding EUR 6.00+ per kg.
- Transit & hub dynamics: Ground handling operations across main European hubs remain stable, though transit connections through Middle Eastern hubs (Dubai, Doha) experience 24–36 hours of transit dwell time during peak weekend departure banks.
- Russian airspace overflight restrictions: Western European air carriers (such as Lufthansa Cargo, Air France-KLM, and IAG) remain barred from Russian airspace, forcing 2-to-4-hour flight detours over southern corridors or polar routes to Asian and Middle Eastern hubs. These longer stage lengths incur fuel burn penalties and strict payload weight restrictions during warm summer/autumn operating conditions, keeping air freight yields to Australia structurally elevated.
Key takeaways

Experienced Business Development Manager with a demonstrated history of working in the logistics and supply chain industry. Skilled in Import/Export, Freight Transportation, Freight, Warehouse Operations, and Overseas Networking.
- BIMCO & European Maritime Safety Agency (EMSA) (September 2026). EU ETS Maritime Phase-in (70% Compliance Target) & FuelEU Maritime Cost Allocation Directives. Copenhagen / Lisbon: Available via BIMCO Regulatory Portal.
- Central Commission for the Navigation of the Rhine (CCNR) & ELWIS (September 2026). Rhine River Water Levels (Kaub Gauge), Inland Barge Capacity Restrictions & Low Water Surcharge (KWZ) Advisories. Strasbourg / Bonn.
- Contargo & Port of Rotterdam Intermodal Advisories (September 2026). European Hinterland Logistics: Rhine Barge Load Limits & Central European Rail Network Congestion. Rotterdam.
- Container Transport Alliance Australia (CTAA) (August / September 2026). Australian Port & Landside Operations: DP World West Swanson Delays, ECP Saturation, Landside Transport & BMSB Compliance. Melbourne: Available via CTAA Official Gateway.
- Daily Cargo News (DCN) (September 2026). Global & Regional Freight Intelligence: West Swanson Terminal Delays, Nhava Sheva Operations & Port Klang Hub Congestion. Sydney: Available via DCN News Portal.
- Department of Agriculture, Fisheries and Forestry (DAFF) (August / September 2026). Seasonal Measures for Brown Marmorated Stink Bug (BMSB) 2026–27 Season & Import Industry Advice Notices (138-2026 & 151-2026). Canberra: Available via DAFF Official Gateway.
- Drewry Shipping Consultants (September 2026). World Container Index (WCI), Trade Freight Rate Benchmarks & Global Container Market Trends (East-West, Intra-Asia, Oceania, ISC). London: Available via Drewry Official Gateway.
- European Maritime Safety Agency (EMSA) / EU ETS Intelligence (September 2026). EU Emissions Trading System Maritime Surcharge Calculations & Fleet Compliance Briefing. Lisbon.
- Freight & Trade Alliance (FTA) (September 2026). Commencement of the 2026–27 BMSB Risk Season, Offshore Treatment Facilities & Australian Border Clearance Briefing. Sydney: Available via FTA Official Gateway.
- Freightos / Freightos Baltic Index (FBX) (September 2026). North America Outbound Ocean & Air Freight Index. London: Available via Freightos Intelligence Portal.
- International Air Transport Association (IATA) (September 2026). European Outbound Air Cargo Yields, Russian Airspace Rerouting Costs & Long-Haul Payload Constraints. Geneva: Available via IATA Industry Gateway.
- Jawaharlal Nehru Port Authority (JNPA) & Sri Lanka Ports Authority (SLPA) (September 2026). Port Performance Bulletins: Colombo Transshipment Dwell Times & JNPA Gate Dynamics. Navi Mumbai / Colombo.
- Linerlytica (September 2026). Global Port Congestion Watch, Typhoon Disruptions, ASEAN/Colombo Transshipment Dwells & Charter Market Capacity Briefing. Hong Kong: Available via Linerlytica Intelligence Gateway.
- Maritime Gateway (September 2026). Port Disruption Alert: Empty-Container Yard Operator Strike Chokes Mundra EXIM Movement. Hyderabad: Available via Maritime Gateway Portal.
- NSW Ports & Patrick Terminals (September 2026). Port Botany Operations Update: Off-Schedule Arrivals, VBS Availability & ECP Capacity. Sydney: Available via NSW Ports Portal.
- Orient Overseas Container Line (OOCL) (September 2026). China–Australia Trade Lane Capacity, Rate Restoration & Port Omission Advisory. Hong Kong: Available via OOCL Customer Advisory Gateway.
- Panama Canal Authority (ACP) (September 2026). Neopanamax Lock Draft Advisory & Fresh Water Surcharge Updates. Panama City.
- Parcel International (August 2026). Ocean Freight Market Update 2026: Navigating Volatility, Demand Surges & Rates. Rotterdam: Available via Parcel International Logistics Portal.
- Port of Fremantle (September 2026). Fremantle Traffic Bridge Closure & Landside Container Logistics Operational Notice. Fremantle: Available via Fremantle Ports Gateway.
- PSA Singapore & Westports Malaysia Operational Advisories (September 2026). Vessel Berthing Waits, Yard Utilization & Terminal Gate Flow Bulletins. Singapore / Port Klang.
- Sea-Intelligence (July / September 2026). Global Liner Performance (GLP Issues 179 & 180): Schedule Reliability, Asian Port Congestion & Cape Transit Variances. Copenhagen: Available via Sea-Intelligence Gateway.
- TAC Index (September 2026). Air Freight Volume & Yield Benchmarks: Ex-Asia, ISC, North America & Europe Outbound Trends. London: Available via TAC Index Official Portal.
- The Loadstar / Sea-Intelligence (August / September 2026). Global Schedule Reliability, Asian Port Berthing Delays & Q4 Peak Bottlenecks. London: Available via The Loadstar News Gateway.
- Vereinte Dienstleistungsgewerkschaft (ver.di) (September 2026). German Port Terminal Industrial Action & Intermodal Transport Advisories. Berlin: Available via ver.di Official Gateway.
- Vizion TradeView Data (September 2026). North American Gateway Trade Volumes & Intermodal Rail Dwell Report. Salinas, CA.
- WorldACD Market Data (August / September 2026). Weekly Global Air Cargo Tonnage, Jet Fuel Surcharges, Regional Yields & E-Commerce Flow Analysis. Amsterdam: Available via WorldACD Intelligence Gateway.
- Xeneta (August / September 2026). Ocean & Air Freight Rate Benchmarking: Pre-Golden Week Capacity, Transpacific Premiums & Coastal Spreads. Oslo: Available via Xeneta Intelligence Gateway.
Frequently Asked Questions
Explorate gives supply chain managers one real-time view across ever forwarder, lane and mode without replacing your current process, partners or systems.

