

Global market alert: Strait of Hormuz
Following the resumption of the US blockade on Iranian ports on July 14 and the subsequent total closure of the Strait of Hormuz by Iran, maritime traffic through the vital chokepoint has effectively frozen. Daily vessel transits have plunged by ~52% week-on-week, leaving commercial corridors largely deserted as ongoing military strikes continue.
Direct impacts on global and local logistics
While these developments do not directly alter the physical routing of China-to-Australia shipping lanes, the macro flow-on effects introduce severe operational risks for Oceania supply chains:
- Surcharges and fuel spikes: The immediate 5% surge in crude oil prices will feed directly into carrier Bunker Adjustment Factors (BAF) and Emergency Bunker Surcharges (EBS) if sustained over the next 14 to 30 days. Shippers should brace for upward adjustments on fuel lines by next month's billing cycles.
- War risk insurance: Insurance premiums for any cargo originating in or transiting the Middle East Gulf are climbing sharply. Any active shipments moving through the India Subcontinent or Middle East trades require immediate premium reviews.
- Oceania capacity flow-on: This crisis completely halts the tentative return of carriers like Maersk and Hapag-Lloyd to the Suez Canal. By locking global container tonnage into lengthy Cape of Good Hope diversions, global vessel supply will remain artificially constrained, preventing excess capacity from entering and softening the Asia-Oceania trade lanes.
- Strict carrier booking restrictions: Space for Middle East cargo has become heavily restricted. For example, ANL is no longer accepting standard bookings to or from inland Middle Eastern hubs, limiting ocean acceptance exclusively to Khor Fakkan, where cargo must then be transferred onto long-haul overland road transport networks.
What's happening in global freight
Global freight markets have entered a highly volatile period heading into late July. The primary driver is a massive geopolitical escalation in the Middle East, marked by the resumption of the US blockade on Iranian ports effective 4:00 PM ET on July 14, following a fourth round of strikes on commercial container vessels in the Persian Gulf.
While the US has announced intentions to act as the "Guardian of the Hormuz Strait" and implement an unprecedented 20% security fee on all cargo transiting the waterway, the operational mechanism remains entirely unclarified. In response, Iran has declared the Strait totally closed. Ongoing military strikes have hit over 300 targets, including the Bandar Abbas naval base, resulting in a ~52% week-on-week drop in vessel transits between July 10–12, with only 3 vessels transiting the corridor overnight into Monday.
This crisis lands just as Maersk and Hapag-Lloyd had begun reintroducing selected Suez Canal services; this new deterioration threatens to stall that recovery entirely, locking global tonnage into lengthy Cape of Good Hope diversions.
Global freight rates
The immediate fallout of the blockade triggered a ~5% jump in global oil prices. If sustained, this spike will feed directly into carrier Bunker Adjustment Factors (BAF) and Emergency Bunker Surcharges (EBS) over the coming cycles. Concurrently, war risk and insurance premiums for Middle East cargo are climbing sharply.
On Oceania lanes, the influx of new capacity has triggered a temporary rate softening ex-China, though carriers are already moving aggressively to deploy capacity discipline to defend market floors.
Key takeaways
- Rates soften into late July for North Asia: The introduction of the new QILIN (Maersk) and A3X (OOCL) services has disrupted the tight supply/demand balance seen through June, resulting in a short-term rate correction.
- South East Asia lanes are rapidly tightening: In contrast to North Asia, carriers in the SEA trade are using disciplined capacity management (blank sailings and service adjustments) to hold rate levels firm despite only moderate demand.
- Bunker surcharges are the critical watch item: The sudden lift in crude oil prices introduces immediate upside risk for fuel siphons heading into the August cycle.
- The 20% transit fee remains unconfirmed: Shippers should treat the proposed US security fee as unconfirmed until ocean lines issue formal billing notices.
- Tonnage stability preserved: Unlike the structural collapses of late 2024/2025, high global rates are keeping extra-loaders out of Oceania lanes, preventing a severe market drop.
Global schedule reliability
Global routing networks face renewed disruption. As vessels in the Middle East go dark or hug alternative coastlines to avoid conflict zones, transshipment hubs are experiencing secondary backlogs. The decision by carriers to maintain Cape of Good Hope routings continues to absorb global vessel capacity, partially offsetting bearish capacity metrics on regional Oceania lanes.
Below is the updated schedule reliability profile based on the latest platform tracking data and operational market changes:
Note: Transit times refer to ocean freight only and exclude inland transport, port handling, and customs clearance.
Key takeaways
- NE Asia dynamic: Capacity has balanced out temporarily due to new QILIN and A3X slot injections, though carriers have actively triggered a major A3C blank sailing for early August to stabilise utilisation metrics.
- SE Asia pressure: Rated as High Risk and Constrained due to complete overbookings ex-Vietnam (Ho Chi Minh) through late July and heavy carrier prioritisation of empty equipment back into Northern Hemisphere trades.
- Middle East flow-on surcharges: India Subcontinent and European lanes remain at High Risk due to the escalating Strait of Hormuz blockade, which has driven up war risk insurance premiums and permanently locked Europe-Australia transit windows into the longer Cape of Good Hope rotation.
Australia
Australia

Operational performance across Australia's major container gateways remains stable heading into late July. While East Coast ports are handling baseline winter import volumes smoothly, landside networks are actively adjusting to the annual July 1 ancillary fee and biosecurity tariff updates. Fremantle continues to face the most notable operational headwinds on the coast.
North East Asia
North East Asia

The China–Australia trade lane is navigating a temporary rate correction as capacity briefly outpaces localised demand. The recent introduction of new service strings has disrupted the tight supply-demand balance seen throughout June, giving shippers a short window of relief. However, robust global container markets are keeping extra-loader tonnage entirely out of Oceania loops this peak season, preserving a much firmer market floor than historical structural collapses.
Ocean freight rates
The North East Asia to Australia trade lane is experiencing a highly dynamic shift as we head into the back half of July. While immediate capacity injections have given shippers some short-term breathing room, carrier alliance maneuvers are already working behind the scenes to establish a firm market floor.
Key market developments
- Rate softening and capacity influx: Ocean freight rates are softening across the trade lane as short-term capacity outpaces baseline demand. The recent deployment of the new QILIN and A3X services has disrupted the tight supply-demand equilibrium observed throughout June and early July.
- A short-term correction: This trend points to a temporary market correction rather than a structural repeat of the Q4 2024/2025 collapses. This peak season, elevated Middle East and Red Sea freight rates are keeping extra-loader tonnage completely out of Oceania lanes, protecting market floors.
- Proactive capacity management: Lines are proving they will actively manage capacity downward rather than letting rates slide. The A3 alliance has officially cancelled the first August service sailing (~7,000–8,000 TEU capacity vessels), effectively neutralising the supply additions from the QILIN and A3X loops.
- Premium price discipline: Signalling high confidence in forward booking volumes, the same premium alliance is firmly holding FAK rates at USD 2,600 per 20GP / USD 5,200 per 40HQ while the rest of the market actively discounts spot rates.

Capacity and schedule reliability
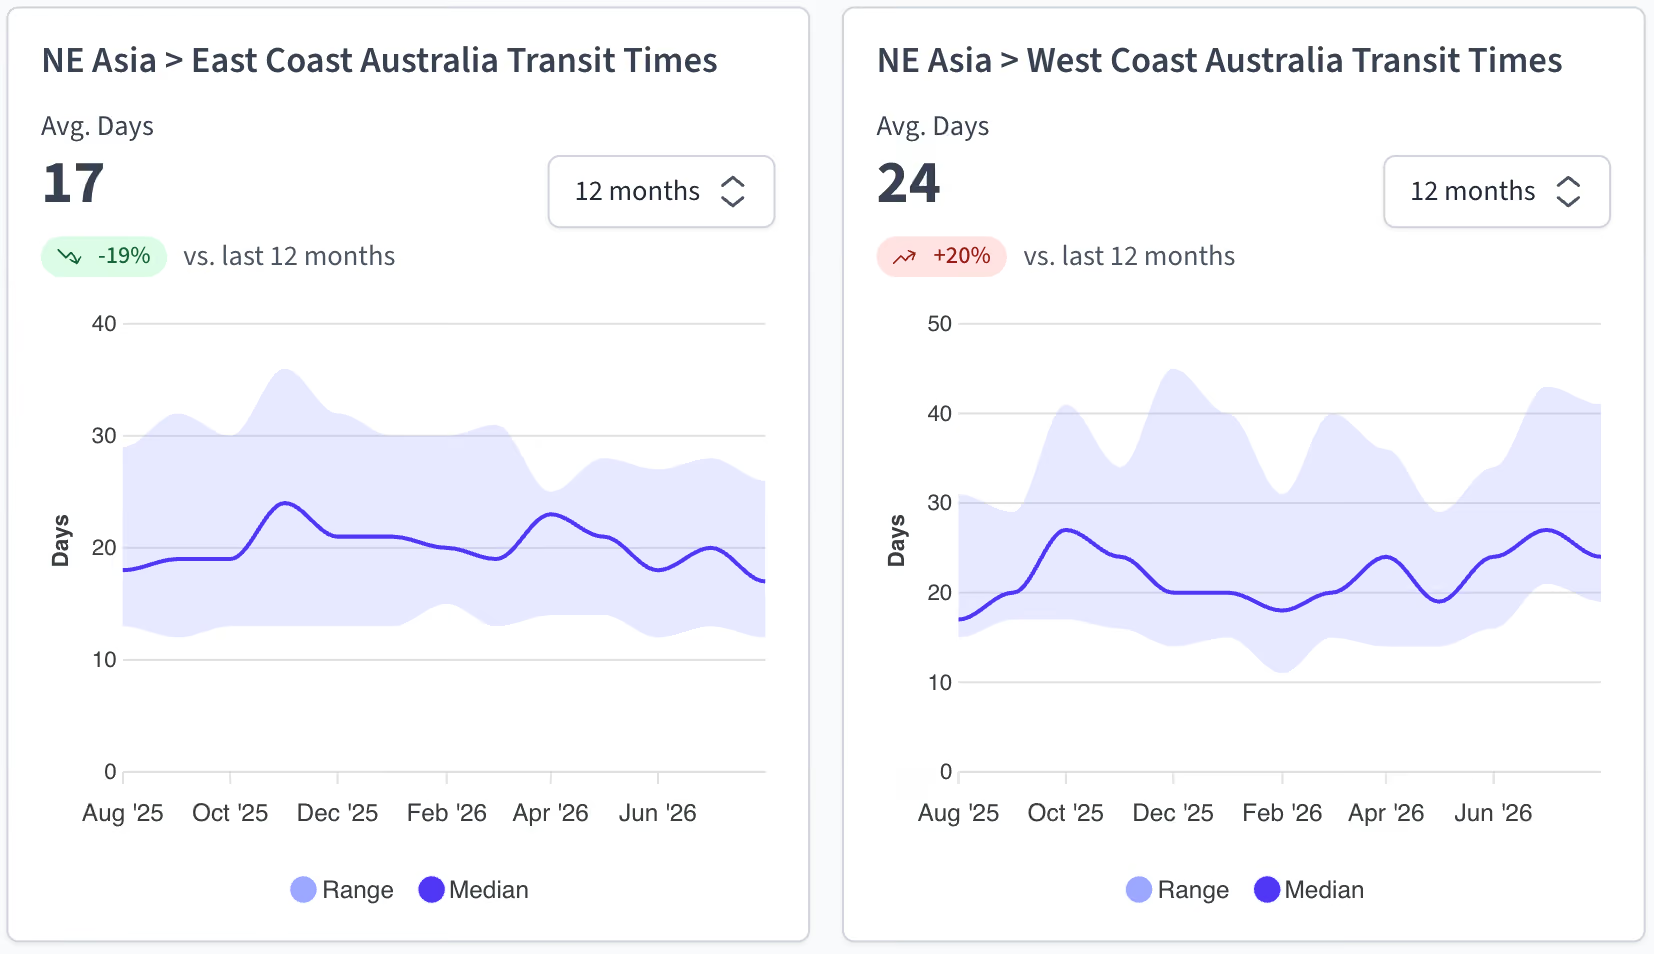
Platform data highlights a massive operational divergence between the two coasts. Driven by the launch of Maersk’s QILIN and OOCL’s A3X services, East Coast transit times have dropped by 24% over the last year, now averaging a sharp 16 days. To protect these utilisation levels, the COSCO/OOCL/ANL alliance has pre-emptively cancelled the first August A3C sailing (~7,000–8,000 TEU vessels) to offset the fresh capacity.
Conversely, the West Coast trade is under severe strain, with transit times spiking by 60% to an average of 32 days. This slowdown is driven entirely by ongoing vessel bunching and severe berth congestion at Fremantle, which has forced lines to build significant planning buffers into all Western Australian loops.
Air freight
Air freight conditions ex North East Asia into Australia continue tightening heading into late July, driven by elevated fuel surcharges stemming from Middle East tensions and subsequent airline flight adjustments reducing available capacity across the market.
Carriers are signalling further freight rate increases moving into August, with forward planning and earlier booking becoming increasingly important to secure uplift, particularly into Melbourne and Sydney.
Key market highlights include:
- Capacity tightening across most major China gateways due to prioritised transpacific electronic/AI hardware flows and sudden carrier network adjustments.
- Freight rates continue trending upward across multiple carriers and trade lanes, particularly ex Shanghai, Taipei, and Hong Kong.
- Melbourne and Sydney are experiencing the greatest pressure, with multiple airlines reporting critically tight space through late July and early August.
- Several carriers are limiting cargo profiles, prioritising smaller high-value/tech shipments or allocating space on a case-by-case basis.
Additional operational disruptions include:
- Sudden fuel-related flight cancellations on select routes throughout late July.
- Reduced frequencies on select mainland Chinese carrier services to optimise load factors.
- Tight second-leg connections via Singapore Airlines and Cathay Pacific.
Some positive capacity developments include:
- Stabilisation of passenger belly-hold capacity on key premium routes into Australia.
- Additional uplift opportunities via Explorate ULD allocations into Sydney and Melbourne.
- Select economy air products remaining comparatively stable on minor lanes.
Overall, the market remains firm with tightening capacity, rising freight rates, and increasing pressure on available uplift into Australia as carriers continue actively managing networks and fuel-related operating costs.
South East Asia
South East Asia
.avif)
While spot rates remain stable for the moment, the South East Asia to Australia trade lane is rapidly tightening. Carriers are deploying strict capacity management, utilising blank sailings and targeted service adjustments—to intentionally choke supply and protect vessel utilisation levels despite only moderate baseline demand.
Key Market Developments
- Space and allocations: Space is severely constrained across all primary load ports, including Singapore, Port Klang, Laem Chabang, and Jakarta. Ho Chi Minh City has become a major pressure point, with lines reporting that all vessels are completely overbooked until the end of July. Cargo heading into Melbourne and Sydney is reaching strict allocations much earlier in the booking cycle than normal.
- Freight rates & GRIs: Most lines are fiercely defending their current rate levels rather than offering volume discounts. If vessel utilisation continues to edge upward, expect small GRIs to be introduced for late July and early August departures.
- The equipment drain: While physical container boxes (20GP, 40GP, 40HQ) are generally available across South East Asian hubs, carriers are actively prioritising the empty repositioning of equipment back to main export zones. They are routing empty boxes away from local lanes to feed their highest-yielding trade lanes (SEA to Europe and US), meaning exporters must book well in advance during peak weeks to guarantee equipment release.
- Schedule and port operations: Schedule reliability continues its steady upward trajectory compared to the first half of the year. Minor transshipment delays persist at the Singapore hub, but they remain well below peak congestion levels. Australian marine terminals are operating normally with only isolated berth delays.
Ocean freight rates
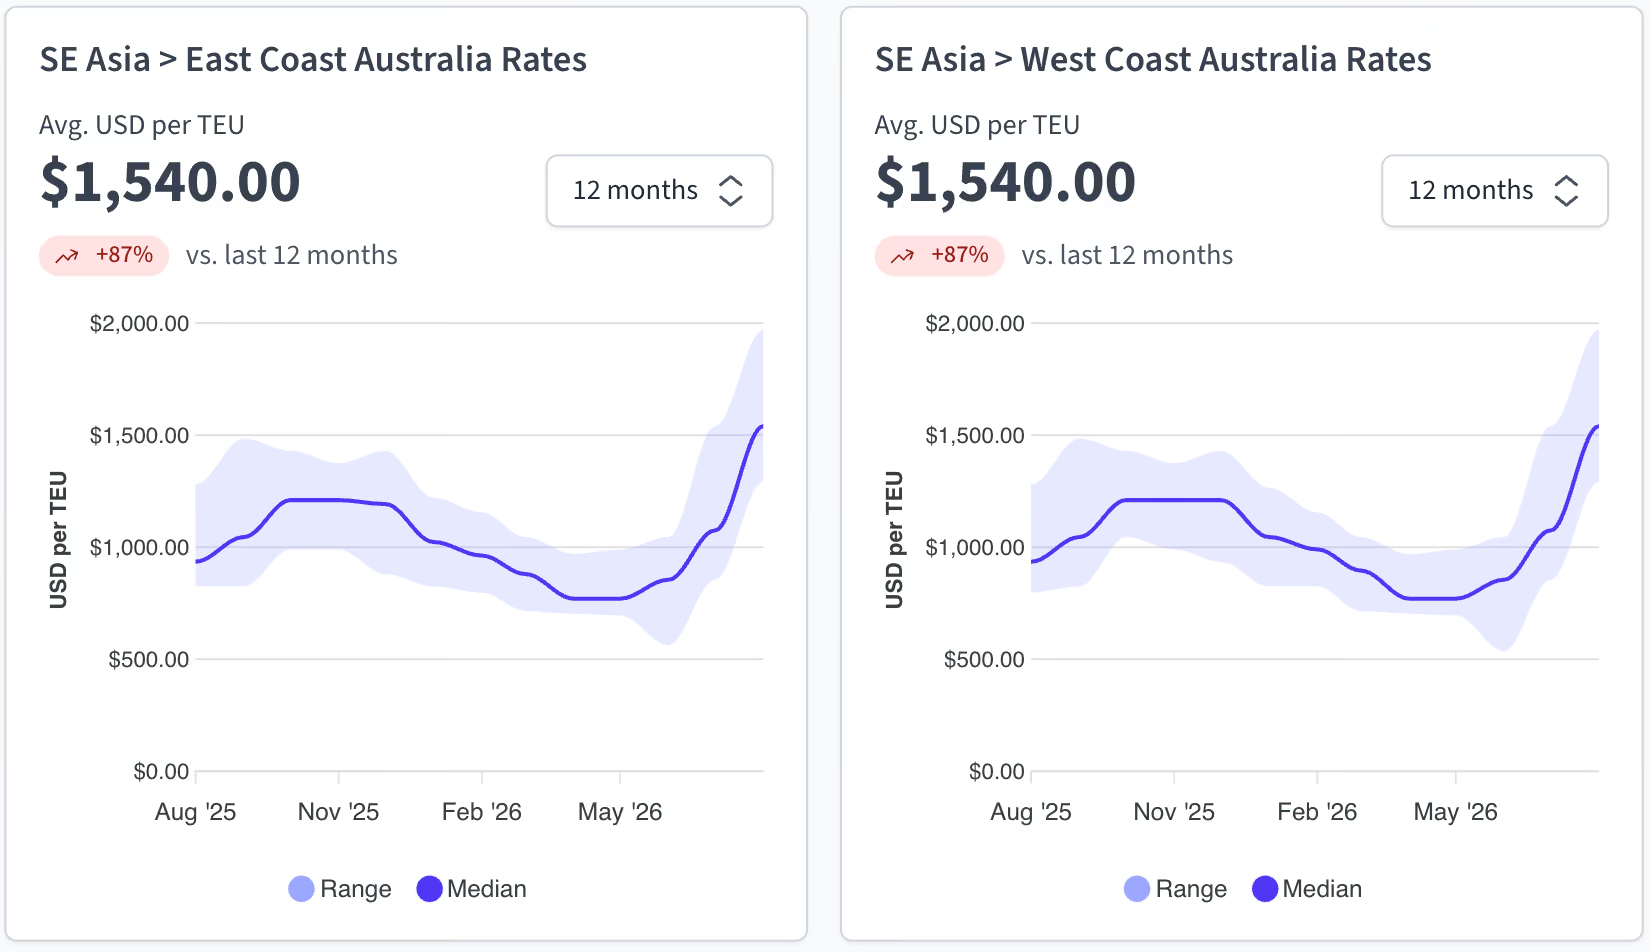
Ocean lines are successfully maintaining their rate baselines, firmly resisting discounting across major regional corridors. Small General Rate Increases (GRIs) are currently under active discussion for late July and early August departures as overall vessel utilisation metrics climb. Bunker surcharges remain the critical variable to monitor, with the ~5% crude oil price spike from Middle East tensions threatening to drive up baseline fuel factors in the upcoming cycle.
Capacity and schedule reliability
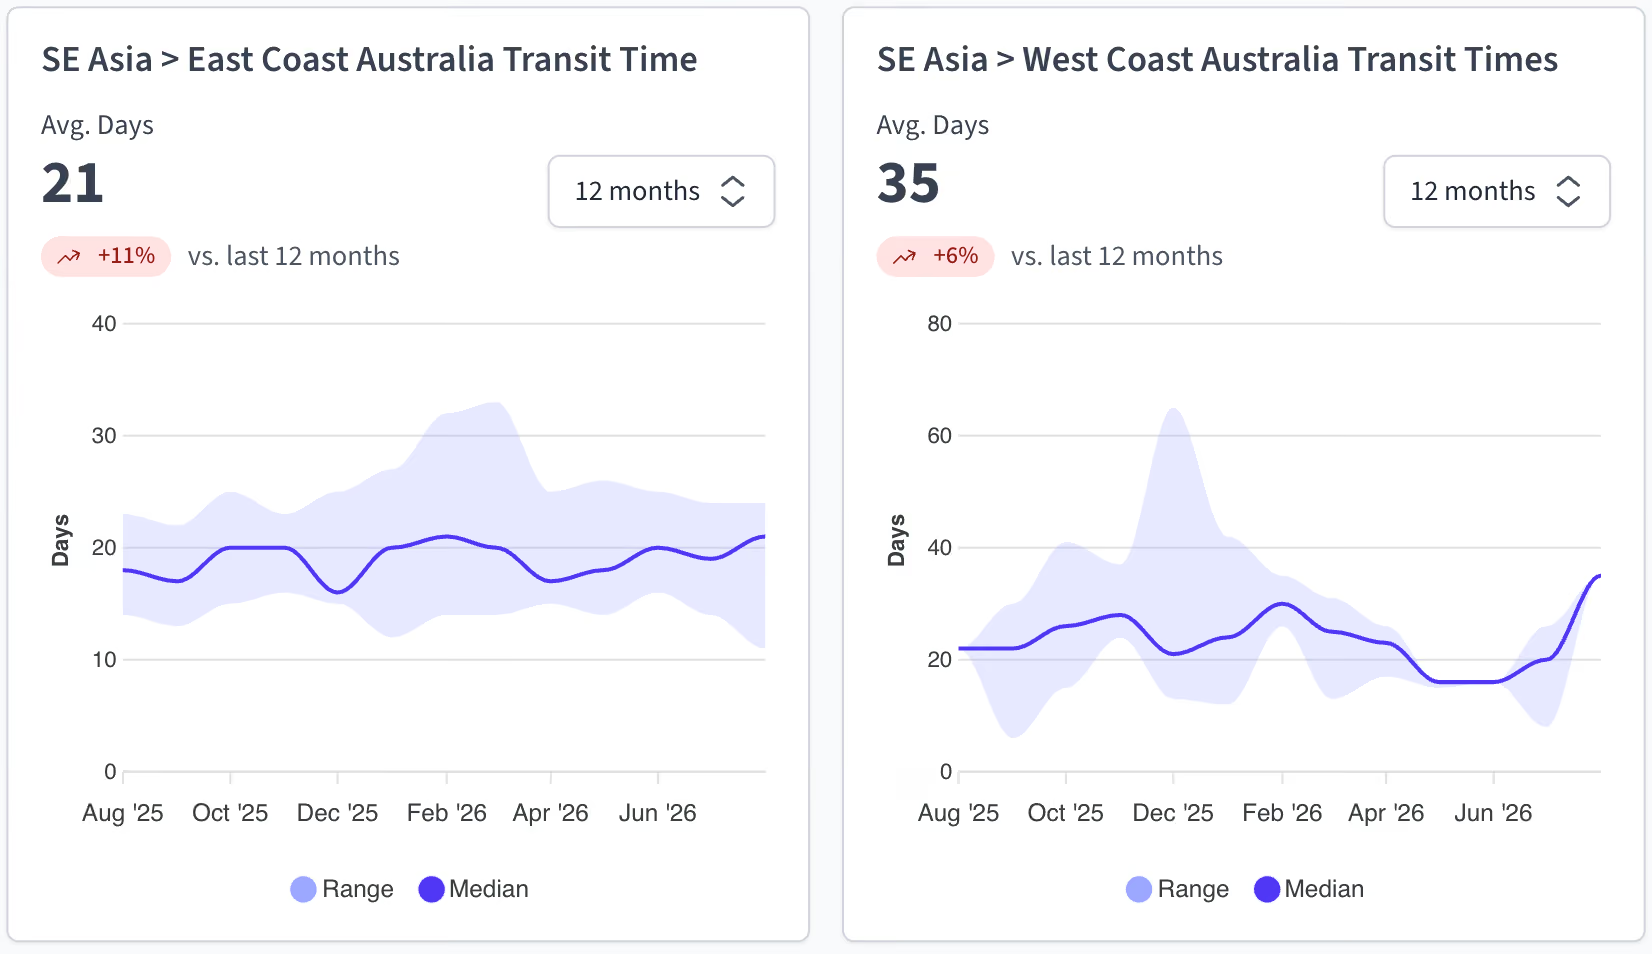
Space is constricting aggressively across all major regional load centres, including Singapore, Port Klang, Laem Chabang, and Jakarta. Ho Chi Minh City has emerged as the primary market pressure point, with carriers reporting that vessels are completely overbooked until the end of July. Selected sailings are reaching their maximum allocations much earlier than normal, with space tightening fastest on loops bound for Melbourne and Sydney. Blank sailings and rolling rates have risen over recent weeks as lines prioritise vessel utilisation factors.
While standard 20GP, 40GP, and 40HC equipment remains physically available across the region, carriers are heavily prioritising the repositioning of empty containers back into South East Asia to feed their exceptionally high-yield long-haul European and US trade lanes. This equipment sweep threatens regional box depth, meaning Australian exporters must book well in advance during peak weeks. Overall schedule reliability continues a modest upward trend; minor transshipment delays persist at Singapore, but they remain well below peak historical congestion levels, holding average ocean transit times to a reliable 10–20 days.
Air freight
Air freight conditions ex South East Asia into Australia continue tightening heading into late July, driven by elevated fuel surcharges stemming from Middle East geopolitical tensions and subsequent airline network payload adjustments reducing available capacity across the market.
Carriers are signalling further freight rate adjustments moving into August, with forward planning and earlier booking becoming increasingly important to secure uplift, particularly into Sydney and Melbourne.
Key market highlights include:
- Capacity tightening across major regional hubs (Singapore, Kuala Lumpur, and Bangkok) due to localised cargo backlogs and ocean-to-air conversions.
- Freight rates continue trending upward across multiple carriers and trade lanes, particularly ex Ho Chi Minh City, Bangkok, and Singapore.
- Melbourne and Sydney are experiencing the greatest pressure, with multiple airlines reporting heavily compressed spot space allocations through late July.
- Several carriers are limiting cargo profiles, strictly managing weight breaks, prioritising smaller high-yield shipments, or allocating main-deck space on a case-by-case basis.
Additional operational disruptions include:
- Sudden fuel-related flight adjustments and payload restrictions on select intra-Asia sectors.
- Reduced frequencies on select regional freighter services as lines optimise load factors on primary East-West corridors.
- Tight second-leg connections through regional transshipment hubs due to compounding arrival delays on incoming European flights.
Some positive capacity developments include:
- Stabilisation of passenger belly-hold capacity on key premium trunk routes into eastern Australian gateways.
- Additional uplift opportunities via Explorate ULD allocations out of Singapore and Kuala Lumpur hubs.
- Select economy air products remaining comparatively stable on non-prime transit lanes.
Overall, the market remains firm with tightening capacity, rising freight rates, and increasing pressure on available uplift into Australia as carriers continue actively managing networks and fuel-related operating costs.
India Subcontinent
India Subcontinent
.png)
The Indian Subcontinent logistics corridor is navigating severe operational complexity, heavily impacted by compounding localised disruptions and the secondary flow-on effects of the Strait of Hormuz blockade. Nhava Sheva (JNPA) has become a critical flashpoint, facing intense landside gridlock due to transport associations launching an indefinite suspension of vehicle transport operations in protest against rising LOLO charges at private empty container yards. This action is severely halting empty container returns and restricting access to critical empty equipment for export shipments. Concurrently, the port is battling vessel delays of 2 to 5 days, driven by Middle East cargo rerouting, chronic trailer shortages, and terminal congestion. With high yard density, narrow export receival windows, and driver shortages slowing import evacuations, space availability into Australia remains exceptionally tight—particularly for lower-rated cargo and late bookings.
Ocean spot rates ex-India remain firm as carriers actively deploy controlled capacity management, selective blank sailings, and port omissions to protect vessel utilisation and maintain recent GRI levels. Furthermore, cargo rolling risks remain highly elevated due to compounding transhipment congestion through Singapore and Port Klang, while periodic infrastructure pressure and export congestion in Bangladesh continue to inject severe schedule volatility across the trade lane, stretching average ocean transit times to a highly unreliable 15–25 days.
Air Freight
Strong regional demand, constrained airline capacity, and ongoing transhipment pressure through key Middle Eastern and Asian hubs continue to impact uplift availability and transit reliability into Australia heading into late July.
Carriers are tightly managing capacity across the market, making forward planning and early cargo readiness absolutely critical to securing preferred uplift and stable pricing outcomes.
Key market highlights include:
- Space availability remains tight across most major gateways, with cargo bound for Melbourne and Brisbane experiencing the greatest pressure.
- Freight rates remain structurally elevated, with airlines continuing to manage space exceptionally conservatively across the market.
- Airlines are actively prioritising higher-yielding cargo, leaving late bookings increasingly subject to severe rollover risk or steep premium pricing.
- Weekend and end-of-month departures remain the most heavily constrained periods for uplift availability across all major regional hubs.
Additional operational disruptions include:
- Ongoing transhipment backlogs through major Middle Eastern and secondary Asian hubs due to dynamic network reroutings.
- Frequent carrier adjustments to flight frequencies and regional allocations in response to volatile fuel costs and network balancing requirements.
- Compounding second-leg connection delays as long-haul international networks absorb global payload restrictions.
Some positive capacity developments include:
- Core passenger belly-hold capacity remaining intact across primary trunk routes into eastern Australian gateways.
- Targeted uplift windows opening via localised freight forwarder blocked space agreements and allocation programmes.
- Select economy air products offering comparative cost stability on non-prime, multi-stop transit lanes.
Overall, the India Subcontinent air freight market remains firm and highly compressed, with constrained capacity, elevated rates, and ongoing operational disruptions expected to persist well into August.
North America
North America

Market conditions ex North America into Australia remain mixed, with stable demand levels continuing across the trade, however operational pressure and schedule disruption persist across several carrier networks.
While overall capacity remains more balanced compared to Asia-Australia trades, schedule reliability and inland network disruptions continue impacting transit consistency and cargo planning.
Key market developments include:
- Early Peak Season Ramping: Import volumes across major North American gateways are surging earlier than historical norms. Importers are actively pulling forward peak-season inventories to hedge against potential late-Q3 supply chain bottlenecks.
- Rate Momentum & GRIs: Ocean carriers are successfully implementing General Rate Increases (GRIs). Transpacific Eastbound (TPEB) rates to both the US West Coast (USWC) and US East Coast (USEC) are experiencing upward pressure, making spot space highly competitive.
- Port Dwell Dynamics: While West Coast ports (LA/LB) are absorbing the brunt of the volume safely, rail dwell times are beginning to creep upward. East Coast ports remain fluid, though carriers are monitoring localised vessel bunching.
- Inland Intermodal Strains: Chassis provisioning and railcar availability at major inland hubs (Chicago, Dallas, and Memphis) are tightening, leading to isolated pockets of increased storage and drayage lead times.
Air freight
Air freight conditions ex North America into Australia continue tightening heading into late July, driven by elevated fuel surcharges stemming from Middle East geopolitical tensions and subsequent airline network payload adjustments reducing available capacity across the market.
Carriers are signalling further freight rate adjustments moving into August, with forward planning and earlier booking becoming increasingly important to secure uplift, particularly into Sydney and Melbourne.
Key market developments include:
- Capacity tightening across major North American gateways (Los Angeles, New York, and Chicago) due to prioritised tech-sector allocations and seasonal adjustments.
- Freight rates continue trending upward across multiple carriers and trade lanes, particularly ex Vancouver, Los Angeles, and Toronto.
- Melbourne and Sydney are experiencing the greatest pressure, with multiple airlines reporting heavily compressed spot space allocations through late July.
- Several carriers are limiting cargo profiles, strictly managing weight breaks, prioritising smaller high-yield shipments, or allocating main-deck space on a case-by-case basis.
Additional operational disruptions include:
- Sudden fuel-related flight adjustments and payload restrictions on select long-haul sectors.
- Reduced freighter frequencies on secondary lanes as lines optimise primary East-West corridors.
- Tight second-leg connections through regional transhipment hubs due to compounding arrival delays on incoming international flights.
Some positive capacity developments include:
- Stabilisation of passenger belly-hold capacity on key premium trunk routes into eastern Australian gateways.
- Additional uplift opportunities via Explorate ULD allocations out of major US West Coast transit hubs.
- Select economy air products remaining comparatively stable on non-prime transit lanes.
Overall, the market remains firm with tightening capacity, rising freight rates, and increasing pressure on available uplift into Australia as carriers continue actively managing networks and fuel-related operating costs.
Europe
Europe
.png)
The Europe-Australia trade remains stable but exposed to ongoing geopolitical and operational risks. Freight rates have largely plateaued following earlier fuel and emergency surcharge increases, although the cost base remains elevated compared with normal market conditions. Demand remains moderate, with sufficient base capacity across most major European origins. However, vessel bunching, port congestion and longer routing continue to reduce effective capacity and create inconsistent schedules.
Ocean freight rates
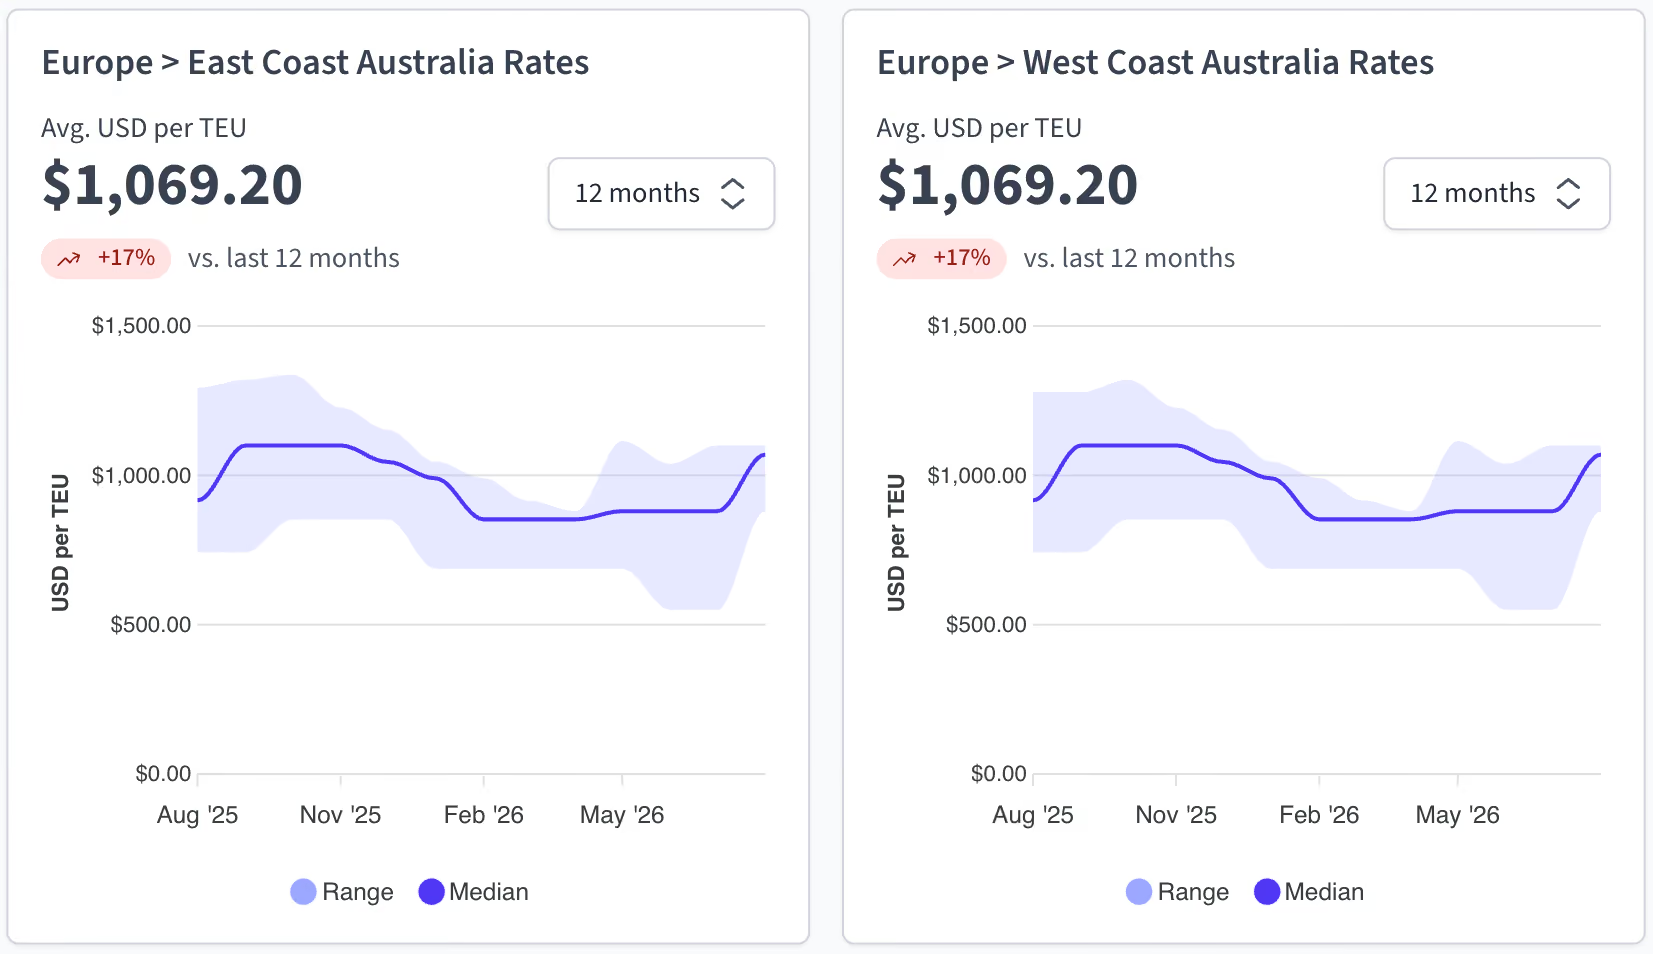
Freight rates have largely stabilised following earlier increases driven by fuel and security-related surcharges. While pricing remains elevated compared with historical levels, carriers are generally holding current rate levels rather than pursuing further increases. Capacity is sufficient across most major European origins, with space available on the majority of sailings, although some premium services are filling earlier than expected. Rate validity remains relatively short as carriers continue to monitor fuel costs, security developments and network adjustments.
Capacity and schedule reliability
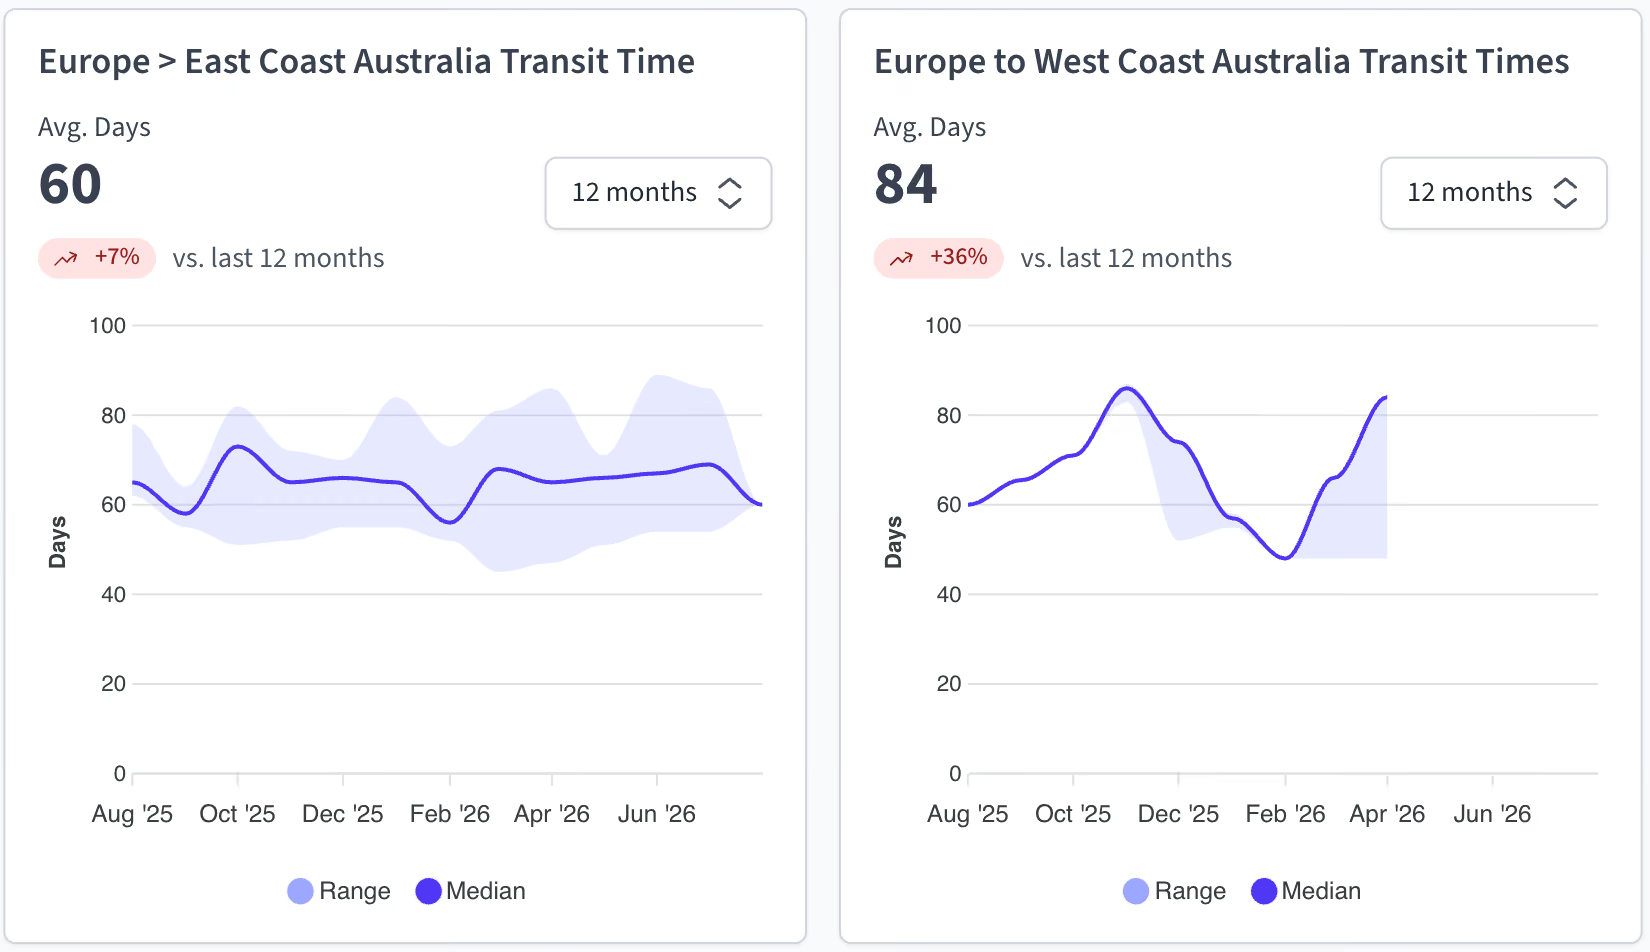
Capacity remains structurally challenged but operationally steady for Europe. Because carriers must completely bypass the Red Sea conflict and route global loops around the Cape of Good Hope, European import timelines to Australia remain stretched by 10 to 14 days, resulting in an extended 42 to 50 days schedule window.
The escalating crisis in the Strait of Hormuz has stalled tentative plans by Maersk and Hapag-Lloyd to reintroduce selected Suez services, ensuring tonnage remains locked on the African route for the foreseeable future. Congestion at major North European hubs like Rotterdam and Hamburg is tracking at moderate levels, and blank sailings are being managed predictably to protect vessel utilisation. While the overall risk profile remains High due to the extended mileage, space remains accessible for shippers booking 3 to 4 weeks in advance.
Air freight
Air freight conditions ex Europe into Australia continue tightening heading into late July, driven by elevated fuel surcharges stemming from Middle East geopolitical tensions and subsequent airline network payload adjustments reducing available capacity across the market.
Carriers are signalling further freight rate adjustments moving into August, with forward planning and earlier booking becoming increasingly important to secure uplift, particularly into Sydney and Melbourne.
Key market highlights include:
- Capacity tightening across major European gateways (Frankfurt, London Heathrow, and Amsterdam Schiphol) due to prioritised transcontinental flows and seasonal schedule balancing.
- Freight rates continue trending upward across multiple carriers and trade lanes, particularly ex Paris, Frankfurt, and London.
- Melbourne and Sydney are experiencing the greatest pressure, with multiple airlines reporting heavily compressed spot space allocations through late July.
- Several carriers are limiting cargo profiles, strictly managing weight breaks, prioritising smaller high-yield shipments, or allocating main-deck space on a case-by-case basis.
Key takeaways
.avif)
Experienced Business Development Manager with a demonstrated history of working in the logistics and supply chain industry. Skilled in Import/Export, Freight Transportation, Freight, Warehouse Operations, and Overseas Networking.
Frequently Asked Questions
Explorate gives supply chain managers one real-time view across ever forwarder, lane and mode without replacing your current process, partners or systems.

