
.avif)
Australia
Australia

Brisbane
Due to the MUA stop work meeting, the Hutchinson’s Brisbane terminal will be CLOSED THURSDAY 21/08/25 between the hours of 1100 and 1500.
Terminal hours for Thursday 21/08/2025 are listed below.
- GATES OPEN 0700, GATES CLOSE 10:30
- TERMINAL REOPENS 1500, GATES CLOSE 22:30
DP World Brisbane Terminal has announced a shutdown for an IT upgrade on Thursday 21st August 2025 from 0500hrs – 1600hrs. Please note the terminal will be shutdown from 0500 to 1600 on Thursday 21/08/25 for an IT upgrade. Please note the gates will be locked at 0500. Last slots will be for 0400.
Sydney
Due to the MUA stop work meeting, the Hutchinson’s Sydney terminal will be CLOSED FRIDAY 22/08/25 between the hours of 1100 and 1500.
Fremantle
Critical maintenance works are scheduled at Common User Berth 11 from 20 August to 3 September 2025 to maintain safety standards and ensure smooth operational performance at the port.
Berth 11 Shutdown – Key Details:
- Shutdown period: 20 August – 3 September 2025
- Scope of works: Deck repairs, bollard and pile refurbishments, and sheet pile wall inspections
- Berthing arrangements: Berth 12 will remain available during the shutdown but limited to vessels up to 200m LOA. As works progress east to west, larger vessels may be accommodated in stages.
- Ro-Ro vessels under 237m LOA may be accepted mid-way through the program.
- Ro-Ro vessels under 265m LOA may be considered in the later stages as the work zone narrows.
North East Asia
North East Asia

Ocean freight rates

While carriers made small rate tweaks during the week of August 8–14, bringing market rates back to roughly USD 1,200–1,450/TEU to manage excess capacity, this shouldn’t be read as a sign of pessimism for the Australia–China trade moving into late August and September.
Current intelligence suggests carriers are gearing up to push rates higher again. The reasons are clear:
- They remain confident in the market outlook for the coming weeks.
- No new ad-hoc vessels are being deployed, keeping overall capacity stable.
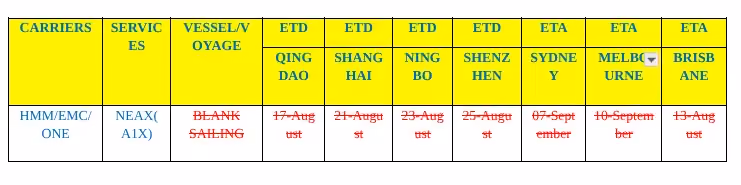
- The cancellation of one NEAX (A1X) sailing in late August slightly reduces capacity versus the first half of the month.
All in all, the stage seems set for upward pressure on rates as we move through the second half of August.
September’s looking busy, and the current rate moves aren’t just carriers flexing, they’re responding to genuine market pressure. Peak Season Surcharges (PSS) are keeping FAK rates steady without penalizing long-term contract shippers, so no one’s being left behind.
NOR offers:
NOR offers have been adjusted, with ZIM actively promoting its service to move more reefer containers back to Australia ahead of peak season. Their promotional rates are attractive: Qingdao/Shanghai/Ningbo/Shenzhen/Hong Kong → Brisbane/Melbourne, providing a strong alternative to current FAK rates. ANL and Maersk have similar offers available for suitable commodities.
Advertised GRIs/PSS:
- ANL: USD300.00 per TEU GRI for all cargo ex South-East Asia, Indian Sub-continent & Middle East to New Zealand. Effective from the 1st September 2025. ANL: USD300.00 per TEU GRI for all cargo ex North East Asia, South East Asia, Indian Sub-Continent & Middle East Gulf to Australia. Effective from the 1st September 2025.
- Maersk: USD500.00 per TEU PSS for all cargo ex China, Japan, South Korea, Hong Kong China, Taiwan China, Mongolia, Cambodia, Laos, Myanmar (Burma), Thailand, Vietnam, Brunei, Indonesia, Malaysia, Philippines, Singapore, Timor Leste to Australia, Papua New Guinea, Solomon Islands. Effective from the 25th August 2025.
- Maersk: USD300.00 per TEU PSS for all cargo ex China, Japan, South Korea, Hong Kong China, Taiwan China, Mongolia, Cambodia, Laos, Myanmar (Burma), Thailand, Vietnam, Brunei, Indonesia, Malaysia, Philippines, Singapore, Timor Leste to New Zealand, Fiji Islands. Effective from the 25th August 2025.
- OOCL: USD300.00 per TEU GRI for all cargo ex Asia to New Zealand. Effective from the 1st September 2025.
- OOCL: USD300.00 per TEU GRI for all cargo ex Southeast Asia to Australia. Effective from the 1st September 2025.
- MSC: USD300.00 per TEU GRI for all cargo ex China, Hong Kong, Taiwan, Japan, Korea, Cambodia, Thailand, Vietnam, Malaysia, Myanmar, Singapore, Philippines and Indonesia to Australia. Effective from the 1st September 2025.
Rate summary: 15th - 31st August
Most Competitive Services: Maersk remains the most competitive carrier option, with rates sitting at USD 1,200 per TEU. The CAT and CA2 services are testing market appetite with USD 1,300 per TEU rate levels.
Mid-Tier Services: The NEAX service delivers near-premium quality on China–Australia routes. Rates for late August are sitting at USD 1,400 per TEU. Vessels reached full capacity before rate confirmation due to a sailing cancellation, indicating sustained rates through late August. The ZAX/PANDA service, jointly run by MSC and ZIM, offers fast transit to Brisbane and aligns with market benchmarks. Rates stand at USD 1,300 per TEU from major Chinese ports to AU East Coast.
Premium Services: The A3 carriers implemented another rate increase this week, raising rates to USD 1,550 per TEU from all major Chinese ports. While initially aiming higher, they took a more conservative approach based on overall market activity
Capacity and schedule reliability

Capacity
Congestion at key transshipment hubs is adding extra days (and frustration) to schedules, despite overall cargo volumes being down. Singapore is running at 90% terminal capacity, while major Chinese ports and Malaysia’s Port Klang are also struggling with bottlenecks.
This week, we’re seeing a sharp uptick in rolled bookings, particularly on the A3 services, which are extremely overbooked. Over just four days, three major vessels are scheduled to depart from Shanghai - each completely full, all A3 services bound for AUEC. At the same time, container shortages are starting to appear out of Ningbo and Shanghai, particularly 20GPs. Carriers are now strictly enforcing NAC allocations, and space is tight because of widespread overbooking. In fact, we’re already seeing NAC-related capacity issues projected as far out as early October, which is going to make planning and securing space increasingly challenging for shippers.
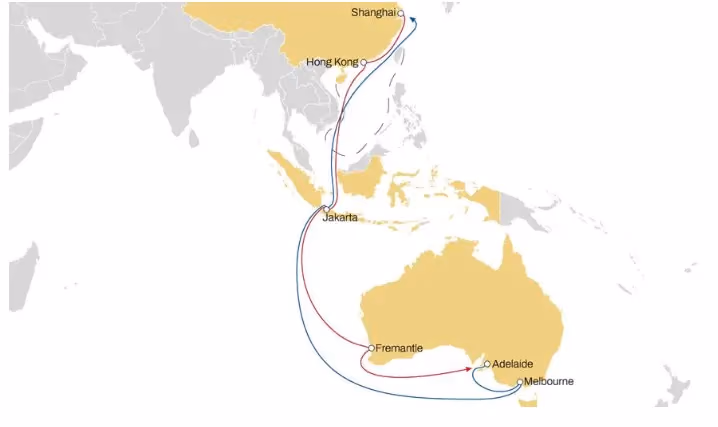
MSC announced an enhancement to the Koala service. The service will provide reefer and dry cargo exporters in Melbourne with competitive transit times and a direct connection to Jakarta, while customers in Brisbane, Sydney, and New Zealand will benefit from improved links via Melbourne. Customers shipping from Fremantle and Adelaide will have additional access to the TRANS-TASMAN market and a direct connection to the Eagle service from February 2026, offering both direct and transshipment routes to the USA via Melbourne.
Effective from vessel MSC CAPETOWN III voyage FP539R, ETD Melbourne 27 September, the new rotation will be as follows:
- Fremantle - Adelaide - Melbourne - Jakarta - Shanghai - Hong Kong - Jakarta - Fremantle. Source: MSC
Black Sailings
The NEAX service is blank sailing in Week 34, with a loading capacity of 5500 TEU.
Schedule Reliability
Schedule reliability from Asia to Oceania sits at approximately 54% in July 2025. This has improved slightly from the May and June figures.
Pelion 001N/002S – A3N Service Update: Due to adverse weather conditions in Asia, ANL has announced important schedule adjustments for the Pelion 001N/002S voyages:
- Brisbane will be omitted, meaning the vessel will not call at Brisbane on these sailings.
- The Asia leg will also skip key ports: Yokohama, Osaka, and Ningbo.
- Instead, the ship’s rotation will be altered to call at Qingdao before proceeding to Pusan.
ALS CLIVIA 001N / 002S – Omit Pusan: ANL has announced that ALS CLIVIA 001N (northbound) and 002S (southbound) will omit the Pusan (Busan) port call due to adverse weather conditions in Asia. This adjustment is intended to assist with schedule recovery for the A3N service.
The vessel Aries 530S/534N will now call Melbourne before Sydney, reversing the usual order to better manage scheduling logistics.
Revised Port Schedule (indicative):
- Melbourne: ETA-ETD 26–28 August
- Sydney: ETA-ETD 29 August – 1 September Brisbane: ETA-ETD 3–4 September
Due to adverse weather conditions, the following vessels will omit Fremantle port:
- MAERSK SHEKOU 532S/535N
- CMA CGM LOIRE MA522A/MA530R
We are continuing to see a significant number of notices regarding changes to port rotations and port omissions across Australia. In some cases, vessels are skipping scheduled southbound calls in favor of northbound stops, which is pushing out ETAs. These adjustments create a complex challenge for matching entries and sea cargo reporting with Customs, often with minimal or no advance notice from the carriers.
Delays are starting to bite at Singapore port, with congestion now pushing transshipment timelines out by two to four weeks. And with volumes ramping up ahead of Christmas, things are only expected to get worse. The ripple effect is also set to hit Port Kelang, so importers should brace for more disruption in the weeks ahead.
South East Asia
South East Asia
.avif)
Ocean freight rates
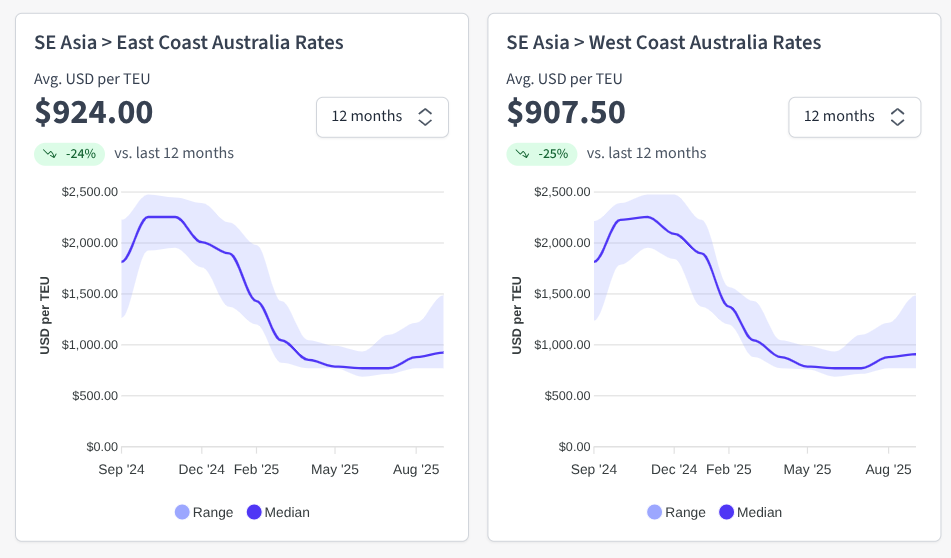
Rates jumped in the second half of August, driven by increased demand and limited supply.
- Singapore & Port Klang rates increased 20% on the most competitive carriers. Pricing varies between USD1050 - 1900 per TEU.
- Haiphong rates also increased 20%, with a range of USD1050 - 2000 per TEU.
- Busan pricing jumped almost 35% on some carriers, with prices varying between USD1250 - 2050 per TEU in the second half of August.
- Taiwan pricing increased by approximately 35%, with a range of USD1050 - 1900 per TEU.
- Indonesia and Thailand saw moderate increases of approximately 12%.
- ANL continues to be the most expensive option out of Southeast Asia, with pricing 35% higher than other carrier options in the market.
Capacity and schedule reliability
India Subcontinent
India Subcontinent
.png)
Chittagong (Chattogram)
- Challenges: Gearless vessels are waiting up to a week or more, about 6 to 10 days, before they can berth, while geared vessels are seeing shorter delays of around 1 to 3 days. With the yard already running at 82% capacity, the congestion pressure is clearly building.
- Contributing Factors: High vessel volumes, limited berth availability, and ongoing operational constraints.
- Impact: Yard occupancy is currently 82%, resulting in longer vessel waiting times (7-day average: 3.89 days) and potential cargo handling delays.
India - Mundra & Nhava Sheva
- Challenges: Monsoon weather intermittently disrupts operations, temporarily halting vessel movements. Nhava Sheva is at a standstill, with vessel movements on hold and delays rippling through container yards, CFS, and transit routes. Flooded roads and rail lines are wreaking havoc on transport, leaving major highways and train tracks underwater and operations seriously disrupted.
- Contributing Factors: Seasonal storms affecting port productivity.
- Impact: Vessels are experiencing waiting times of 1.25 days at Mundra and 1.07 days at Nhava Sheva, causing minor schedule disruptions.
- A relentless surge of monsoon rainfall has severely disrupted life across India, with Maharashtra, particularly Mumbai, bearing the brunt. Between August 18 and 19, Mumbai received an extraordinary 500 mm of rain over 84 hours, prompting the first red alert of the season. The city has been crippled by widespread flooding, transport gridlock, power outages, and inundated roads, forcing school and office closures and triggering numerous flight delays. Sadly, several lives have been lost amid the chaos. Concurrently, the IMD has issued heavy rainfall warnings for states including Telangana, Odisha, Karnataka, Andhra Pradesh, Chhattisgarh, and Goa, while a depression in the Bay of Bengal fueled intensifying downpours, causing rivers to breach danger levels and necessitate mass evacuations. Source: The Hindu
Sri Lanka – Colombo
- Challenges: Moderate congestion with manageable vessel delays.
- Contributing Factors: Regular cargo volumes and terminal operations.
- Impact: 7-day average vessel waiting time: 1.06 days, minimal operational disruption.
Israel – Haifa
- Challenges: Elevated risk environment due to security warnings from the Houthi rebel group, targeting vessels associated with Israeli port calls.
- Contributing Factors: Geopolitical tensions impacting vessel movements and scheduling.
- Impact: 7-day average vessel waiting time: ~2 days, with heightened caution required for operators and potential routing adjustments.
North America
North America

Ocean rates
Record Import Volumes: June and July volumes at the Port of Los Angeles hit a historic high. Despite this, inland drayage rates remain below pre-pandemic levels, squeezing carrier margins while offering shippers a temporary cost advantage.
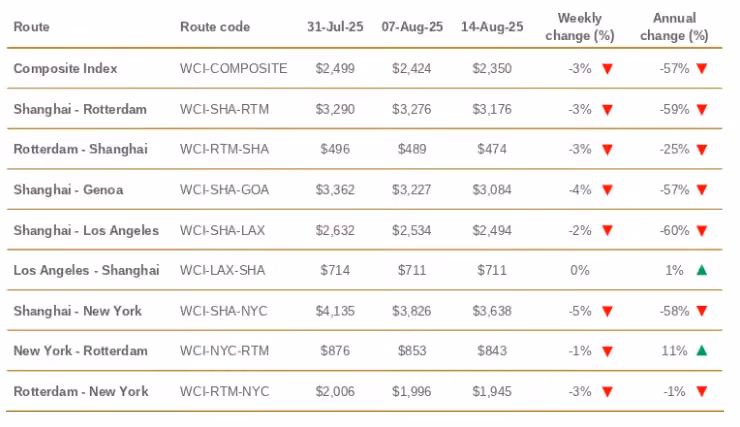
Shanghai–Los Angeles rates fell 2% to USD 2,494 per FEU, while Shanghai–New York dropped 5% to USD 3,638 per FEU. With the pre-tariff shipping rush now behind, it is expected that spot rates on U.S.-bound trade lanes to remain less volatile in the near term.
The North American container market continued to soften for the week ending August 15, with bearish sentiment across Trans-Pacific lanes as peak season momentum faded and the US-China tariff pause failed to drive demand. North Asia–East Coast North America rates dropped to $2,550/FEU (-$150) and North Asia–West Coast North America fell to $1,600/FEU (-$100). South America trade lanes also saw declining rates, with North Asia–East Coast South America down $400 to $3,200/FEU and East Coast South America–US Gulf Coast falling $300 to $1,800/FEU. Trans-Atlantic North Europe–East Coast US rates remained steady at $1,600/FEU despite ongoing port congestion in Europe. Source: JOC
Advertised GRIs:
- ANL: USD250.00 per TEU for all cargo ex United States and Canada to Australia, New Zealand, the Pacific Islands, and Papua New Guinea. Effective from the 1st September 2025.
- Maersk: Peak Season Surcharge (PSS) for United Arab Emirates, Bangladesh, Bahrain, Bhutan, India, Iraq, Jordan, Kuwait, Sri Lanka, Maldives, Nepal, Oman, Pakistan, Qatar, Saudi Arabia, Yemen to USA and Canada East Coast & Gulf effective from 7th August 2025
Capacity
Chassis shortages are impacting US cargo at inland terminals.
Exporters are in a tough spot right now, with empty containers in short supply thanks to a drop in Asia-U.S. imports. The problem is hitting hardest at U.S. Gulf Coast ports and inland rail ramps, where the usual container flow has been turned upside down. Rail terminals at Memphis, Nashville, and Dallas are hardest hit with delays upwards of 4 days.
Exports from the US to AU are seeing relatively low demand, so there’s still good space available on direct sailings. CMA CGM has been hit by ongoing congestion at European ports, which has affected its reliability and left it trailing behind MSC and Hapag-Lloyd’s direct services. Indirect services aren’t faring much better, with delays piling up at busy Asian transshipment hubs. With peak season about to start, we may soon see capacity tighten and schedules become less predictable.
Carriers on the Asia–North America lane have pulled back 17 sailings, equal to nearly 5% of weekly capacity. The bulk of these cancellations, 10 services, affect the West Coast, while 7 are tied to the East Coast. This pattern suggests lines are leaning more heavily on West Coast capacity cuts to counter softening demand, while still managing exposure on all-water services to the East.
Schedule Reliability
- Schedule reliability remains uneven. While trans-Atlantic services appear stable, blank sailings and capacity adjustments on trans-Pacific and South American routes are extending transit times and creating planning challenges for shippers. Combined with the frontloading of cargo earlier in the year, these factors are contributing to unpredictability in arrival times and complicating operational planning, particularly for carriers attempting to maintain rate integrity.
- Hurricane Erin, the Atlantic’s first hurricane of the 2025 season, has rapidly intensified to a powerful Category 4 storm, briefly reaching Category 5, before weakening to Category 2 as of August 19. Although the storm is forecast to remain offshore, it continues to pose serious coastal hazards along the U.S. East Coast, especially from Florida to New England. Authorities are responding with beach closures, evacuations (notably in North Carolina’s Outer Banks), and state of emergency declarations in areas like Puerto Rico and the U.S. Virgin Islands. Erin is generating massive waves (up to 20 feet), life-threatening rip currents, storm surge, erosion, and widespread flooding. Source: CNN
US Tariffs
Key updates (as at 20th August 2025):
- Steel & aluminium tariffs now apply to 400+ new products: including wind turbines, furniture, compressors
- India hit hard: $48B in exports now face 50% tariffs
- Average U.S. tariff rate spikes to 18.6%: highest since the 1930s
- De minimis threshold scrapped: from August 29, all low-value imports face new fees
- Tech sector on watch: potential 300% tariffs on semiconductors pending investigation
- Tariffs now a key revenue driver: S&P maintains U.S. credit rating despite debt concerns
👉 De minimis gone, tariffs up, tech at risk – read the full breakdown
Europe
Europe
.png)
Ocean freight rates

Port congestion and capacity constraints along Asia–Europe trade routes are contributing to more unpredictable pricing, as vessels face delays and reduced service reliability.
European container markets kept sliding for the week ending August 15, with spot rates on both North Europe and Mediterranean lanes now at their lowest since early June. North Asia–North Continent (PCR1) dropped $200 to $2,500/FEU, and North Asia–Mediterranean (PCR3) fell $100 to $2,500/FEU. Carriers are cutting FAK rates to keep cargo moving, and sources reckon rates below $2,500/FEU could soon be the standard if this trend continues. Source: JOC
Capacity and schedule reliability

Capacity
Even with Asia–Europe loops running above 90% utilization, extra ships shifted from Trans-Pacific trades are keeping pressure on rates. Carriers are trying to manage this with blank sailings and skipped port calls, but demand is so soft that it’s only slowing the decline, not reversing it. Expect more blank sailings through September and October as carriers continue to juggle muted volumes and changing buying patterns. Source: JOC
A growing mismatch between available infrastructure and container demand is one of the core issues. Over the past 15–20 years, port capacity expansion in Europe has lagged behind market growth. Terminals such as Antwerp-Bruges are under significant pressure due to limited landside space, while deployment of larger vessels and continued rerouting around Africa, driven by security risks in the Red Sea, are intensifying yard congestion. On prominent routes like Asia–North Europe and Asia–Mediterranean, overall shipping capacity has dropped by 15–20% in recent months.
Schedule reliability
Last-minute vessel changes, erratic rotations, and rolled cargoes are making planning a headache. Major hubs, Antwerp, Hamburg, London Gateway, Le Havre, are all seeing delays. And a fire on the 19,076 TEU Marie Maersk enroute from Rotterdam to Malaysia adds yet another layer of uncertainty, with potential knock-on delays for mid-to-late September cargoes. All told, schedule reliability is shaky, and shippers need to be ready for surprises.
Berth delays and slower cargo handling are causing vessels to spend extended periods in port, negatively affecting schedule reliability. July schedule performance dropped significantly, with overall on-time performance falling to 55%.
Belgium
- Challenges: Severe congestion with berth waiting times increasing by 37% between March and May.
- Contributing Factors: High yard utilization, labor shortages, and increased import volumes.
- Impact: Delays in container handling and increased logistics costs.
Germany
- Challenges: Elevated yard utilization at certain terminals.
- Contributing Factors: High import volumes and ongoing infrastructure constraints.
- Impact: Possible delays in container handling and increased logistics costs.
Netherlands
- Challenges: Elevated yard utilization, with some terminals operating at near full capacity.
- Contributing Factors: High import volumes and limited terminal capacity.
- Impact: Potential delays in container processing and increased risk of bottlenecks.
France
- Challenges: Shortage of reefer and dry containers, with truckers sometimes informed last-minute about equipment unavailability.
- Contributing Factors: High import volumes and equipment shortages.
- Impact: Delays in container pickup and increased logistics costs.
United Kingdom
- Challenges: High yard utilization, with some terminals operating at near full capacity.
- Contributing Factors: High import volumes and limited terminal capacity.
- Impact: Potential delays in container processing and increased risk of bottlenecks.
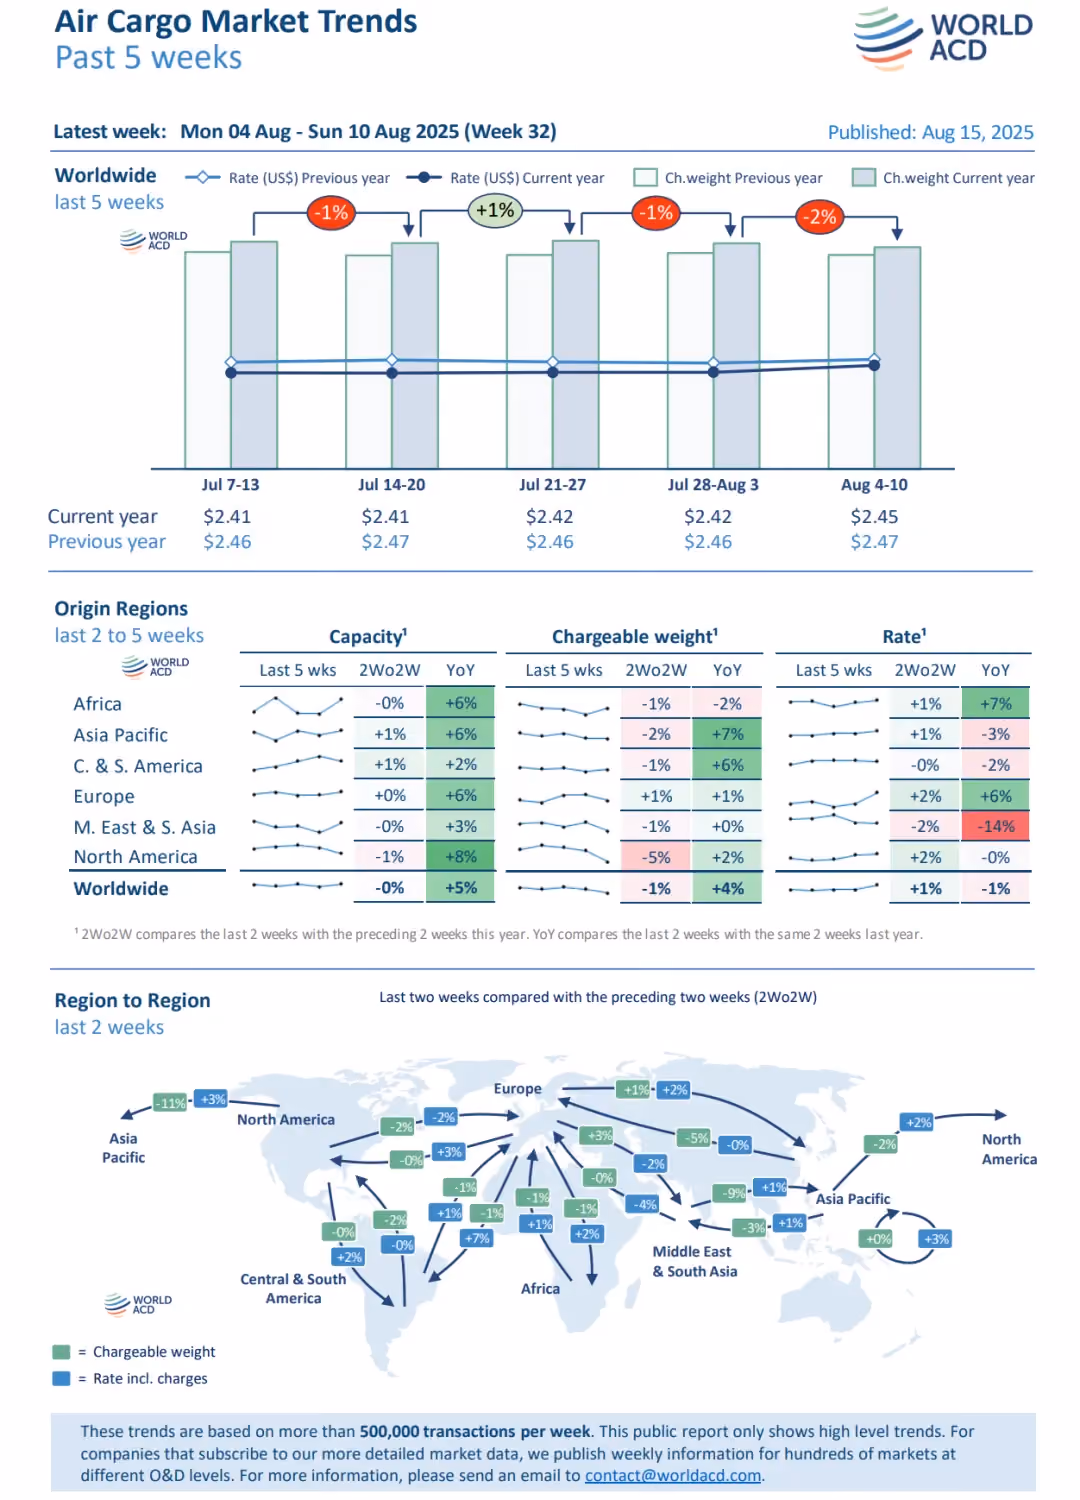
Global air freight
In week 32 of 2025 (August 7–13), global air cargo volumes declined by 2% compared to the previous week, marking the second consecutive week of reduced tonnage.
This downturn was observed across major regions: North America (-5%), Europe (-3%), and the Middle East & South Asia (-4%). Conversely, Africa (+3%) and Central & South America (+1%) experienced growth, while Asia Pacific volumes remained stable.
Despite the volume decrease, average worldwide air cargo rates increased by 1% week-on-week, driven by higher rates from Europe (+3%) and Asia Pacific (+1%). Year-on-year comparisons show a 1% decline in global rates, with notable increases from Africa (+9%) and Europe (+7%).
Export dynamics from Asia Pacific indicate a shift, with tonnage to Europe decreasing by 1%, attributed to declines from China (-3%), South Korea (-10%), and Indonesia (-18%), while exports to the U.S. remain more stable.
Overall, the market exhibits signs of seasonal softness, with modest fluctuations in capacity and rates. Source: World ACD
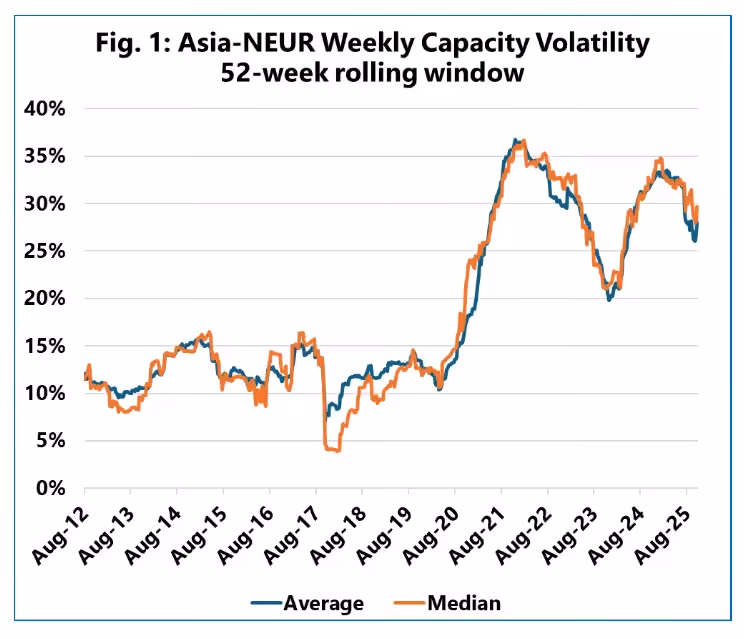
Global shipping overview
Sea-Intelligence’s latest analysis (Issue 726 of the Sunday Spotlight) reveals that since the pandemic, weekly shipping capacity on key East–West trade routes has become significantly more volatile, resulting in "lumpier" cargo flows that are disrupting port operations. Pre-pandemic (2011–2019), weekly capacity volatility on the Asia–North Europe trade lane averaged around 12.3% (primarily between 10%–15%), but surged to 29.6% in the 2021–2025 period, more than doubling. Similar sharp increases were seen on Asia–Mediterranean routes. While the Transpacific routes also experienced higher volatility - about a 50% rise from ~20% to ~30% - the fluctuation was less pronounced compared to Asia–Europe trades. This heightened instability is a key contributor to ongoing port congestion, as terminals struggle to manage the unpredictability.
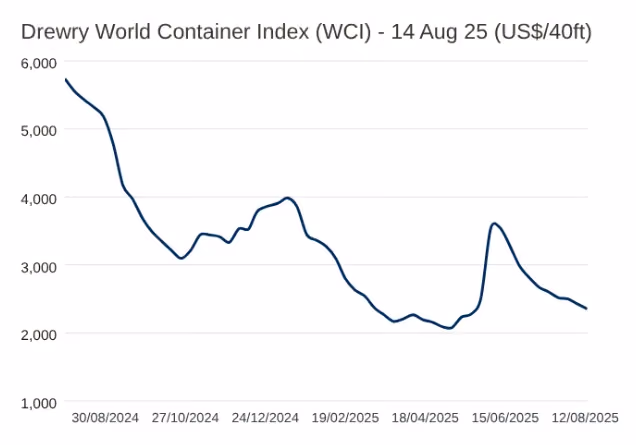
Drewry’s World Container Index (WCI) has declined for nine consecutive weeks, showing signs of stabilization after a volatile stretch. The instability was triggered in April following the announcement of U.S. tariffs, which drove rates sharply higher from May through early June. A steep correction followed, lasting until mid-July, before the pace of decline slowed, indicating that rates are now settling into a steadier pattern.
General news
- Typhoon Podul struck Taiwan’s southeast coast on Wednesday 15th August, with winds up to 191 km/h and torrential rain reaching 600 mm in some areas, prompting school and workplace closures across nine cities, the evacuation of over 5,500 residents, and widespread flight cancellations. The storm caused flooding, landslides, and power outages before moving into southern China, where authorities in Fujian, Guangdong, and Guangxi evacuated 15,000 people and suspended public services. While damage reports remain limited, the heavy rain and disrupted transport are already affecting regional logistics, shipping schedules, and supply chains. Source: The NY Times
- China now requires exporters of certain commodities to hold export licences and comply with its export control regulations. Key changes from 25 March 2025 include mandatory tax registration before customs clearance, prohibition on declaring exports under a third party’s name, and a dual-title requirement where factories without licences must be listed alongside a licensed customs broker with full manufacturer details for tax verification. Compliance can be achieved by updating business registration to include “import & export,” registering via China’s Single Window System, and completing local tax procedures. A transition period runs from 1 August to 30 September 2025, after which violations may result in fines or legal penalties. Exporters are advised to seek guidance from a Chinese customs agent or legal professional. Source: FTA
- On August 18, 2025, a Liberian-registered cargo ship, the W-Sapphire, experienced a powerful explosion and fire while anchored in Baltimore’s Patapsco River near the former Francis Scott Key Bridge collapse site. The blast sent a fireball and thick smoke into the air, alarming nearby residents, though all 23 crew members were reported safe with no injuries. Tugboats helped move the vessel to anchorage, while the U.S. Coast Guard established a 2,000-yard safety zone and launched an investigation. Eyewitnesses described a deafening boom and heavy smoke, with some initially mistaking it for bridge demolition work. The cause of the explosion remains under investigation. Source: DC News
- The Maritime Union of Australia (MUA) has strongly criticized DP World’s AU$600 million (US$390 million) automation plan for its Australian container terminals, including those in Sydney, Melbourne, Brisbane, and Fremantle, warning that the initiative risks eliminating hundreds of wharfies’ jobs and undermining supply chain stability. While DP World highlights the move as a way to enhance efficiency and optimize logistics via technologies like automated stacking cranes (ASCs), remotely operated cranes, AI, and digital twins, the MUA contends that it comes at the expense of workers and prioritizes profit over community and labor interests. Source: World Cargo News
- Air Canada's recent labor deal has set a new precedent for airline crew compensation in North America. After a four-day strike that grounded thousands of flights and affected over 500,000 passengers, the airline and the Canadian Union of Public Employees (CUPE) reached a tentative agreement. The deal addresses long-standing issues of unpaid work, particularly for tasks performed during boarding and deplaning, which were previously uncompensated. This move could influence ongoing negotiations at U.S. carriers like American, Southwest, Alaska, and United, where similar grievances have led to contract rejections. However, the changes may increase operating costs substantially - American Airlines’ new contract could cost an additional $4.2 billion over five years, while Air Canada could face up to C$140 million in new expenses. Despite potential financial strain, industry leaders agree that systemic compensation reform is necessary, driven by higher inflation, wage stagnation, and heavier workloads post-pandemic. Source: Reuters
Interesting Articles
- Container Shipping Oversupply to Linger through 2029
- More pain for US importers as more metals are hit by tariffs
- Trump Admin Weighs Plan to Take 10% Stake in Intel
- Shein Mulls Move Back to China Ahead of Hong Kong Listing
- Tariff strategies, economic clouds: What to know for rest of 2025
- Amazon brings same-day perishable food delivery to 1K cities and towns
.avif)
Experienced Business Development Manager with a demonstrated history of working in the logistics and supply chain industry. Skilled in Import/Export, Freight Transportation, Freight, Warehouse Operations, and Overseas Networking.
Frequently Asked Questions
Explorate gives supply chain managers one real-time view across ever forwarder, lane and mode without replacing your current process, partners or systems.